
This report presents the results from a nine-month study of three federal government statistical websites. The study was undertaken from October 1996 to June 1997 under the auspices of the Bureau of Labor Statistics and examined the BLS website, CPS website co-sponsored by BLS and the Bureau of the Census, and the FedStats website sponsored by the Interagency Council on Statistical Policy. The main objectives of the study were to determine who uses these services, what types of tasks they bring to the sites, what strategies they use for finding statistical information, and to make recommendations for design improvements.
Given the range of services and users and the complexity of the human-system interactions such an investigation entails, a multifaceted set of methodologies were used to collect data. These included: reviews of literature and existing websites, site mapping, document analysis, individual interviews and email questionnaires with staff at different government agencies, focus groups with various intermediaries responsible for aiding the public in finding statistical information, content analyses of user email requests, usability tests with representative end users, and transaction log analyses. These methodologies were selectively applied to the different websites. In some cases, they entailed the invention of new data gathering and analysis techniques. Taken together, the methodological retinue provide an exemplar for agencies to adopt for ongoing application to monitor, maintain, and evaluate their online information services.
Users
A wide variety of user types for the sites were identified. These were:
business users,
academic users, the media,
the general public,
government users,
education (K-12) users,
statisticians, and
users in libraries/museums and other non-profits.
Tasks
Users bring a wide variety of statistical needs to these websites.
By integrating results from the different data collected, a multidimensional
task/question taxonomy
was developed.
The pragmatic (contextual) dimension includes attributes in three categories:
-
goal (learn,
verify, judge, explore, refer, subtask, ongoing, plan),-
constraints
on the task (time, volume, geographic location), and-
system (database
match to task, search and extract tools, formats, entry point and path).
The semantic dimension includes attributes of topic, level of abstraction,
level of specificity, and number of facets.
The syntactic dimension includes attributes in three categories:-
expression type
(what, where, who, how, and why), -
goal type (closed,
interpretive, accretional), and -
specificity
of expression.
Strategies
Results are based mainly on transaction logs for the BLS site.
Many users abandoned their session after one or two requests.
Users were found to be mainly purposeful in their information seeking
and strongly guided by the organization of the website.
There were differences in how some classes of users conducted their
sessions with more sophisticated users , especially those from .GOV and
.COM
domains, conducting longer, more frequent sessions using more data-rich
information services.
Design Recommendations
A variety of specific design recommendations are made in the report.
The most general recommendations for all sites include:
add vocabulary clarification features such as authority lists, query
expansion, thesauri, and spell checkers;
consider some specific reorganization based on project results, e.g.,
A-Z list in Fedstats, moving Occupational Outlook Handbook higher in the
BLS organization, and emphasizing timely data releases on the home
page;
consider using the task taxonomy as a template that guides user interaction;
consider developing alternative interfaces that users may adopt to
suit their needs; and
develop systematic help, FAQ, and tutorial modules for sites.
Policy Recommendations
In addition to these results, several general agency organizational
observations and recommendations surfaced during the study. Most generally,
agencies should:
develop suites of evaluation techniques, tools, and procedures that
are regularly applied and used to guide site evolution; and
agencies should develop and publicize policies for collection development
and public access and support for the various websites and other online
public services.
These recommendations should be part of efforts to manage change as
the online information services change and concomitantly change the agencies
themselves.
In the summer of 1996, Gary Marchionini (University of Maryland) and Carol A. Hert (Indiana University) were invited by the Bureau of Labor Statistics (BLS), Office of Research and Evaluation to undertake a 9 month (September 1996 - June 1997) investigation and evaluation of several websites provided by and/or sponsored by the Bureau. These sites are:
Each of the sites was developed with a particular goal. These are:
BLS:The primary user of the BLS site is someone who knows or believes BLS has statistics relevant to their needs. The site should meet the needs of external users.
CPS:As defined in the late 1980's, the original goal was to provide BLS and Census staff access to all the micro-, macro-, and metadata associated with the CPS production process. The site is now geared more towards the external rather than the internal customer.
FedStats:The site should provide entry to statistics produced by about 70 Federal organizations covered in the OMB report on the budget for Federal statistics. The primary users are people who do not know which agencies have statistics relevant to their needs.
During the first meeting in October 1996, preliminary goals for the project were established. BLS staff expressed an interest in understanding how people were using the various sites, including their tasks (or goals) and their strategies for moving about the sites. Arising out of these discussions were the following specific questions which were to guide the analysis:
1.What categories of information seekers use the sites?
2.What are the tasks (or goals) in which these information seekers
are engaged?
3.What strategies are employed by information seekers as they use the
site?
4.What are the design implications for the sites of answers to the
previous questions?
Several of these terms need definition in the context of this study
as they are often used interchangeably in the information science literature.
The broadest "information seeking unit" we discuss is an information need.
Thus a person who may be making a decision to relocate and decides to look
for information on various cities is engaging with an information need.
The task is a specific action taken in support of that information
need. Thus the decision to look for the CPI for various cities is a task
associated with the relocation information need. The goal is the
expected (or hoped for) outcome of the task. Thus the goal of looking for
the CPI
for several cities is the set of CPI's for the cities. A strategy
is a plan for action, these may be both mental (such as top-down problem
solving) and system oriented (starting with keyword searching). Strategies
are executed via tactics and moves which are the actual discrete
behavioral actions of a user on the system (such as pressing a key). Presumably,
when the goals are well-matched to the information need, the task is appropriate
to the resources and user abilities, and the strategies are well-executed,
then the information need will be met.
Our purpose in this study was to provide additional theoretical insight into the design and evaluation of Websites, in particular, those providing statistical information and associated information. The study team also found the focus on information seeking to be theoretically interesting as the connection between information seeking strategies and system design implications, particularly in the area of statistical information, is under-developed. A literature review found only 1 study (reported in Robbin and Frost-Kumpf, 1997; and Robbin, 1992) which described empirical work in this domain (See Appendix 1-1).
1.3 Overview of Study Activities
The goal of the first several months of the project (through January 1997) consisted of the development, on the part of the study team, of a rich understanding of the three sites and the context in which they existed. This led into the specification of the methodology to be employed during the remainder of the project. The study methodology evolved throughout the project as additional insights were gained by the study team of the nature of the sites and the needs of the agencies. The methodologies developed as a result of the project are themselves important contributions to the continued development and management of the three websites. The final set of data collection activities are described in Section 2 of this report.
Activities engaged in during the early months included literature searching, reviews of other statistical websites (see Appendix 1-2), interviews with selected BLS staff, gathering of mission statements for the sites, and ongoing discussions among the study team as to how best to gather data and divide the work. As a result of these discussions there began to be distinctions made between the BLS and CPS sites and the FedStats site due both to their differing maturity levels and primary missions and somewhat different methodologies were decided on for the sites. At the January 13, 1997 meeting, these preliminary methodologies were proposed, modified upon comment from BLS staff and the FedStats taskforce, and a revised set of data collection and analysis activities provided.
Some data collection activities were started during the early period of the study but most reached full swing during the period January - May 1997. A report of the status of the various activities (and some preliminary findings) was provided during the May 6, 1997 meeting and approval provided for the final report structure and reporting mechanisms.
The project goals concerned complex systems and processes and all participants agreed that a variety of methods and approaches were necessary to address these complexities. Thus, a multifaceted investigation was undertaken that included a variety of data collection techniques and an ongoing triangulation process that integrated the different data to address the research questions. In some cases, new methodological procedures were invented and the explication of an overall evaluation suite is itself an important deliverable for the project.
A multifaceted approach to web usability testing was also a strong theme adopted at the ACM SIGCHI Workshop (March 23-24 in Atlanta) for which the project team prepared a position paper describing our approach (http:www.acm.org/sigchi/webhci/chi97testing/). Such an approach has been used successfully in evaluating other complex systems and processes (e.g., Marchionini & Crane, 1993; Harter & Hert, 1997; McClure, 1997) and is analogous to a medical CAT scan where diagnosticians collect data on multiple views of the organ of interest, and aggregate and integrate these views into a diagnosis. One important distinction in the methodology used here is that the views use different data collection techniques rather than one technique applied successively. A second important distinction from a CAT scan is that these methodologies are applied repeatedly over time as an ongoing part of the development and maintenance of the online services.
There was an investigative phase (October, 1996-January 1997) during which time we worked to clarify the research issues and understand the websites and respective government organizations. For this phase, we used five data gathering methods: literature and website reviews, expert critiques of the websites, site mapping, document analysis, and interviews (personal interviews with BLS and Census personnel working with the BLS and CPS sites, and electronic questionnaires with the Interagency Council on Statistical Policy Task Force responsible for the FedStats site (referred to in the remainder of the report as the FedStats task force) and support staff in statistical agencies contributing to FedStats).
The second phase of the project focused on data collection based on user activities: online interviews and focus groups (for FedStats), content analysis of email requests (for BLS/CPS), impressionistic analysis of online comments (for FedStats), usability tests (for FedStats), and transaction log analyses (for BLS/CPS). In some of these cases, new data collection and analysis techniques were devised.
The study team brought a broad range of methodological expertise to the project and thus was able to significantly extend the data collection activities beyond those generally employed in Website analysis and evaluation. Most Website evaluation activities have employed either usability testing or transaction log analysis or both in tandem (e.g., see various position papers at http:www.acm.org/sigchi/webhci/chi97testing/). We also built upon the April 1996 usability study conducted by and Fred Conrad and Michael Levy for the CPS site. We employed these as well but extended our data collection activities to include several not normally employed including content analysis of email messages, focus groups, and a variety of interviews.
Transaction logs are automatically captured by the Webserver and thus are readily available for analysis. In this study, the team made significant enhancements to typical analyses (these are reported below). Transaction logs provide information about the pages accessed by users, information which provides some guidance for answering Research Question 2. Additionally, we were able to map "paths" through the site which provided information associated with Research Question 3.
Usability testing is often employed in Website design and evaluation (as in other interactive systems) as the investigation of people using the system often leads to insights about aspects of the design that expert designers may not have gathered. We therefore chose to do some usability testing, particularly for the FedStats site, where the design was still emerging and early usability testing might lead to significant changes in site design.
The study team would have been remiss to not take advantage of human expertise resident in the various agencies. The BLS and the other FedStats agencies have a long tradition of public service which has involved answering mail, telephone, fax, and in-person queries. These experts were useful sources of information about the types of users they had helped in the past, what types of queries those users brought, and how the experts themselves had helped them (which provided insight into strategies and system design). Thus the study team identified several populations of staff involved with helping the public, as well as several other staff with a stake in the various sites (such as the FedStats Task Force).
These experts preserve some of their communication with these users. Email messages to the BLS Labstat email address are routinely saved. Analysis of email messages enabled us to look at the content of users' queries which provided yet another vehicle for developing a taxonomy of user tasks on the sites. With the official "opening" of the FedStats site in late May 1997, online comments from that site have also become available.
The BLS and other agencies also have an interest in expanding their services to new populations of users. In order to understand the needs of these sets of users (and gather additional information on current users), it was important to speak with users. Since the user communities (actual and potential) constitute the population of the United States and beyond, the study team identified types of intermediaries (e.g., librarians, teachers, statistical consultants) who help the larger population locate, access, and use statistical information. These intermediaries were likely to have information about tasks and strategies aggregated from the users they have served.
Table 2.1.1 summarizes the data collection activities of the study.
(INSERT TABLE 2.1.1)
2.2.1 Expert critiques. We systematically examined the three web sites for two purposes: first, to become familiar with the content and structure of the sites; and second, to make suggestions for improving the sites. The products of these activities were site maps and various specific recommendations related to screen layouts and site features and organization. We sometimes used personally constructed scenarios (e.g., explain what the geometric mean formula means for the CPI; what is the unemployment rate for Hispanic Americans in Arizona) and sometimes reconstructed sessions logged by the server.
2.2.2 Interviews. We conducted two types of interviews. First, we interviewed analysts and help desk personnel at BLS and Census. For this purpose, we created an interview protocol that guided questions in the following categories: Content/Context of the service, Users, Strategies (those used by both staff and by users), and Other (see Appendix 2-1). Eight people were interviewed using this protocol. Two interviews were conducted in person and six were conducted over the phone. Interviews typically lasted one hour and in four cases more than one of the research team members participated in the interview. Notes from the interviews were emailed to the participants for verification and clarification.
The second type of interview technique took the form of email questionnaires and was applied to two groups of people responsible for the FedStats site. FedStats became publicly available on May 22, 1997. Prior to that time, it was available in prototype form and could be used by only those who knew the URL for the site. Due to the very limited number of users, we relied heavily on the expertise of the FedStats Taskforce, and on the experience of staff in the participating FedStats agencies. The experiences and perceptions of these groups were solicited via electronic questionnaires.
A questionnaire was sent to the FedStats task force in January 1997 via the FedStats electronic mailing list. All members of the task force responded to the questionnaire (see Appendix 2-2), though two members reported that they did not have public service responsibilities or were on the task force for reasons not related to public service and so did not supply answers. Five usable questionnaires were received and tabulated. Since all responses were open-ended in nature, answers that seemed significantly similar were grouped together.
A questionnaire similar to that employed in the BLS interviews was developed to send to help staff in various agencies (See Appendix 2-3). These staff were identified by members of the FedStats task force. The questionnaire was electronically distributed to these staff using individual email addresses. 15 questionnaires were sent, 11 were returned. One reminder was sent to the non-respondents but no further surveys were received. Agencies represented in the returned questionnaires were: Bureau of Economic Analysis (2), Bureau of Labor Statistics (3), National Science Foundation (3), and the National Energy Information Center (3). The returned questionnaires were tabulated. Since all responses were open-ended in nature, answers that seemed significantly similar were grouped together.
2.2.3 Focus Groups. Focus groups are group interviews with 5-10 participants in which a topic is explored (the focus) by the participants (Kruger,1994). They have been widely employed in settings where the phenomenon is not well understood because the respondents can offer information and/or move the discussion in directions not predetermined by the researcher. In exploratory settings, a predetermined questionnaire may miss valuable insights. Additionally, they are most appropriate in situations where group learning or group attitude forming is appropriate. For example, focus groups have been used widely in marketing surveys because consumer buying preferences are shaped by group perceptions of products. A focus group is facilitated by the researcher who asks some opening questions and keeps the discussion focussed on the topic at hand.
Findings from focus groups are qualitative in nature, providing rich pictures of the phenomenon as experienced by the participants, but do not yield generalizable results both due to the unrestricted structure of the discussion and the tendency to have non-random selection of participants. Our employment of focus groups in this study was predicated on several conditions: the exploratory nature of the project, the desire for respondents to learn from and be exposed to the ideas of other participants, and the need to reach a number of people in a short space of time.
Three focus groups were held in Bloomington, and Indianapolis, Indiana during April 1997. A total of 19 respondents participated. (See Table 2.2.3.1 Focus group participants were identified through contacts provided by members of the FedStats Task Force. An effort was made to reach a wide range of participants who provided data to constituent groups. Some participants were active data users themselves. The focus questions were:
What is your role in helping people find federal statistical information?
What types of questions do the public ask about federal statistics?
What tasks lead the public to ask for federal statistical information?
What types of information or data do you provide to the public in response
to these questions or tasks?
How do you help people find statistical data now?
How do you think people go about finding statistical data on their
own?
How might a Web-based service (such as FedStats) affect how people
find statistical information?
What else is important for us to understand about the public's use
of federal statistical information?
In a focus group, the interviewer uses the questions as probes but allows respondents to take the discussion in other directions. Therefore the questions above represent a general sense of the topics covered during the focus group interviews rather than the only questions asked.
TABLE 2.2.3.1 FOCUS GROUP PARTICIPANT SUMMARY
Focus Group 1 (April 10, 1997, Indianapolis, IN.): 8 respondents
3 researchers/analysts from a university-sponsored urban/economic
analysis planning institute that focusses on regional issues,
director of information services at a statewide business data center,
librarian at the statewide Chamber of Commerce,
economic analyst with a large Midwestern bank's economic research department,
analyst at state government economic division
Focus Group 2 (April 16, 1997, Bloomington, IN.): 6 respondents
research analyst in a social science data center for university
affiliates (students, faculty, etc.)
head of Public Services at a public library
university government documents librarian
university librarian who works with students in education and also
directed a project to make social science data (including Census) available
via the Web
analyst with Indianapolis city planning department
analyst with university-sponsored survey research center (specialist
in sample selection)
Focus Group 3 (April 17, 1997, Indianapolis, IN): 5 respondents
analyst in statewide economic development agency
public librarian in Business/Economic division of large urban central
library
analyst at statewide business data center
government documents librarian at the State Library
analyst for the research and planning arm of United Way of Indiana
2.2.4 Content Analysis of Email. BLS receives hundreds of email requests per month from users. These requests come to the LabStat help desk and to individual analysts in various BLS departments. These requests provide insights into the kinds of problems users have with the system and the kinds of statistical problems they bring to the websites. Although it is important to keep in mind that the email requests represent a self-selected sample of the overall user population, the volume of requests and variety of topics and expertise make this sample particularly valuable for answering the project research questions. Content analysis is a methodology that seeks to find patterns in textual data (e.g., Holsti,1969; Krippendorf, 1980). For the purposes of this project, a content analytic strategy for electronic mail messages was developed and tested.
In this study, we were able to gather 2 months of messages sent to the BLS Labstat email address. We also received a smaller set of messages (Sept. - Nov. 1996) which had been received by the CPS helpdesk staff. The CPS messages were analyzed first, and a coding scheme was inductively derived from those messages (see below). This coding scheme was then employed (with minor modifications) to code the BLS data. Summary information about the messages is found in Table 2.2.4.1.
Table 2.2.4.1: Email Summary Information
Number of
Email Source Date Number of Messages Questions
CPS Sept.-Nov. 96 90 126
BLS Labstat Nov. 96 379 657
BLS Labstat March 97 569 827
The study team inductively derived a content analytic coding scheme for the email message content. An inductive strategy is useful in situations where no taxonomy exists prior to analysis, as was the case here. There is limited guidance available in the literature about how queries concerning statistics and associated information might be categorized. The scheme development process followed general principles provided by Krippendorf (1980) and Holsti (1969). As messages were read, categories were preliminarily developed. After the analyst had a sense that no new categories were being added to the scheme, the preliminary scheme (and associated coding rules) were formalized. A second analyst then received the scheme and both analysts coded the same subset of the messages (10% of the sample). Coding decisions were jointly reviewed to confirm that the scheme was detailed enough for any coder to reach the same decision about codes for a message as any other coder.
Several statistics are available to verify that coding agreement is due to the reliability of the coding scheme and not random chance. We used Kappa (Cohen, 1960), a statistic which considered the number of decisions made and the expected occurrence of agreement if chance alone was operating. At the point our kappa was tabulated, our value was .71. A value of .6 or higher is generally considered sufficient to indicate that chance alone is not accounting for the agreement. With this level of agreement, the messages were divided between the two coders, who then went through all the email messages and tabulated instances of various codes.
The coding scheme employed is indicated below (Table 2.2.4.2). It has two dimensions which were coded for each question in a message. (Some messages had more than one question and each question was coded separately.) In all cases, it was the correspondent's language that was used. For example, the coders did not attempt to infer whether a person asking where a particular data item was actually was asking for the number itself as there was no way to assess that distinction.
The first dimension captured the content of the question. The second dimension captured the nature, or strategy of the query. Both dimensions are necessary to understand the nature of a particular question. A tabulation matrix (presenting in the findings sections of the report) was developed with content type on one dimension and strategy/question on the other.
TABLE 2.2.4.2: Email Coding Scheme
Date of Finalization: 13 March 1997
Authors: Carol A. Hert, Kim Gregson, Anita Komlodi
I. Content Dimensions
This dimension describes what type of information the user requested
System: the website itself ( as opposed to the ferret search tool on CPS, for example, which goes under tools). This category includes questions relating to how the website is organized/structured.
Data: question related to actual values of variables or for actual information (such as, "I need information on the economic outlook for Atlanta")
Methods: anything related to how the data were collected such as how many surveys were conducted, as opposed to metatdata which would be information about the meanings of variables, codes, etc.
Metadata: information about the meanings of variables, codes, etc.
Tools: tools for data manipulation, such as ferret, available on the Website
Publication: BLS information in paper form (whether it is stats, methods, etc.)
Costs: questions relating to how much things cost (such as "how much would it cost me to get data on...")
Other
II. Strategy/Question Type Dimension
This dimension describes what the user wants to know about the information they indicated and what form the question took (strategy).
What: content/definition of
How: process
When: time of
Where: location/access to, including directions to answer questions such as "can you direct me to...", use only when they explicitly ask about location as opposed to existence or that they can't find something
Do you have - existence of
Is it an error
Why: rationale for something
Who
Other
Coding Rules:
Code all questions in each email. Code at the sentence level, thus if a respondent says "I need data on x statistic. Can you tell me where to get this", code this as 2 questions: a what/data and a where/data. However, if a respondent says, "I need data on x statistic, y statistic, and z statistic. Where can I get access them?" it would get coded as only 2 questions: a what/data and a where/data. Multiple examples of types of data should not be coded separately.
Code each question on both dimensions (content & strategy/question type).
Use the respondent's language to help determine which type of question it is.
On the coding sheet, each email message should be listed by email address. If there are multiple questions within each email, they should be numbered consecutively. Thus if Smith had 4 questions, the coding would be Smith 1/4, Smith 2/4, etc.
Some messages are not about any data or publications available from BLS. For example, if a message gives the user's resume or describes a new business site, code those as Other.
2.2.4.1 Further Analysis of Email. After coding and tabulating the 2 sets of BLS messages, it was apparent that only a few categories had large numbers of questions associated with them. These were: what/data, where/data and do you have/data. A second content analytic scheme (Table 2.2.4.3) which was more specific than the first was developed in order to gain a more detailed understanding of the nature of these numerous questions. We were interested in knowing whether particular statistics or types of statistics were frequently requested--what in particular were people asking for? An answer to that question might suggest some particular design recommendations for index or button choices. (For example, if most questions asked for the CPI, it might be useful to place a link to the appropriate table on the BLS homepage.)
The second scheme was also inductively derived as described above. The two analysts had 90% agreement in their coding choices in the subset of questions coded and thus the scheme was finalized as it appears below. Again there are two dimensions. The first is the content dimension: what type of statistic is being asked for. The second dimension captures characteristics of the data requested. Three characteristics were indicated by requesters: regionality, time, and amount (or number) of statistics wanted. (These dimensions were also suggested by focus group participants as being important.) An analyst coded all questions which fell into the what/data, where/data, and do you have/data categories.
Table 2.2.4.3 Coding Scheme for "Data/What" Email Questions
Date of Finalization: 16 May 1997
Author: Kim Gregson
I. Content Dimension
These are specific statistics, such as the CPI and PPI, as well as general topics that are most often asked for.
Employment/Unemployment : e.g., # of employees, employment rates, job qualifications and outlooks
Productivity: any measures of productivity such as work stoppage, job retraining, time lost to work accidents, # on the job injuries, absenteeism
Compensation: such as average salaries, salary ranges, comparative salaries, income of business owners, fringe benefits, effects of education on salary
Prices: cost of living, historical survey of prices, national inflation rate
Federal Government Related: effect of defense spending cutbacks, money spent by government agencies, government related requests that do not fit into any of the other categories
Demographics:
CPI: (note: CPI and PPI were coded separately due to the frequency of requests in the data set)
PPI:
Other:
II. Specificity Dimensions (pick one from each of the following dimensions)
These are ways people make their data requests more specific.
1. Time (if not given, code most current)
most current: latest, this year's, this quarter's, most recent
series: for a range of dates, for a time series
historical: one specific time in the past
2. Location (if not given, code national)
city: city, county, local, MSA, multiple cities for comparisons
state: a specific state
region: multiple states, general regional description such as
the Southwest
national: US as a whole
international: specific countries or continents
3. Amount (if not given, code one)
one: a specific statistic, even if it is in a request for a
time series
Code only messages that were coded as data/what in a previous
coding pass.
Code all requests for data in each of those messages.
For each request, code four pieces of information - one content description, and each of the three aspects of the specificity dimension: time, location, and amount. Examples are provided for each choice.
Use the respondent's language to help determine which type it is.
On the coding sheet, each email message should be listed by email address. If there are multiple questions within each email, they should be numbered consecutively. Thus if Smith had 4 questions, the coding would be Smith 1/4, Smith 2/4, etc.
2.2.5 Usability Tests. Usage of the FedStats site was investigated during a series of usability tests held in Bloomington, IN and Washington, D.C. Three tests were held. The structure of each test was as follows. A group of users (ranging in size from 4-7) explored the system simultaneously (each person at a computer) for approximately an hour (see Table 2.2.5.1). Subjects were paid for participation in the tests. The exploration was guided by two scenarios designed by the research team and one scenario developed by each individual. Scenarios are a widely used strategy for usability testing (Carroll, 1995). They enable both a somewhat structured experience (so that researchers can have respondents experience the parts of the system in which researchers are particularly interested) as well as allowing flexibility for respondents to employ their own choice during system use. The scenarios used in this study were as follows:
1.You're writing a newspaper article or letter to an editor and you need the latest figures on average weekly earnings for blacks and whites to make a point. You also want a clear definition of just how unemployment is defined.
These scenarios were designed to investigate the functionalities of the FedStats site rather than those of the sites of the individual agencies. As FedStats' primary purpose is to support the location of statistics and associated information, the predetermined scenarios focussed on tasks involving statistics location rather than statistics use.
Respondents were instructed to write down their "answers" on the sheets describing the scenarios for further analysis by the research team. In addition, they were asked to use the Bookmark function of Netscape to indicate pages that were particularly helpful during their explorations. Unfortunately, due to the use of frames in the FedStats site, the bookmark files were not usable. In frames, what gets bookmarked is the frame itself rather than the page in the frame.
Following the system explorations, the respondents completed a short questionnaire (Appendix 2-4) designed to capture some demographic data as well as a variety of summary satisfaction measures. These measures were based on measures from the validated survey: University of Maryland Questionnaire for User Interaction Satisfaction (Chin, Diehl, & Norman, 1988). The session concluded with a group interview of approximately one hour to one hour and a half with the purpose of debriefing the respondents on the experience. The following types of information were solicited:
How did respondents go about answering each scenario?
What strategies did respondents employ to work through the scenarios?
What factors (system, personal, etc.) influenced the respondents' perceived
successfulness?
What helped the respondent accomplish the scenarios?
What hindered the respondent from accomplishing the scenarios?
How could the OSS site be changed to increase the respondents' ability
to use it successfully?
What kinds of questions do they think the site in its current form
would be useful for answering?
How could the homepage (and top level) OSS pages be organized to increase
a user's ability to use the site successfully?
What else is it important for us to know to understand how they used
the site during this session?
Would they ever use this site again?
Table 2.2.5.1: Usability Test Summary
Bloomington, Indiana: 28 March 1997 with seven participants.
- database manager
- graduate student/assistant instructor
- graduate student
- sociology graduate student
- graduate student
- non-degree international graduate student
- graduate student/associate instructor
Washington DC: 19 May 1997 with four participants.
- senior Biology major
- senior Physics and Music Composition dual major
- first year Law student
- senior in joint BBA/MSIS program
Washington DC: 27 May 1997 with six participants.
- political management graduate student
- Civil Engineering graduate student
- MBA, just graduated
- doctoral student, on leave from position as school teacher
- junior, political communications
- third year Law student
2.2.6 Transaction log analyses. Web server software routinely log every request for information. The BLS site receives approximately one million "hits" (requests to the server) per month and the resulting server logs contain hundreds of megabytes of data each month. These data are appealing because they represents the activity of the entire population of users each month rather than the more typical samples of activity other data sources provide. Throughout the computing community there is a long history of interest in log analysis from multiple perspectives: improving web site design and services (e.g., Nielsen; CHI workshop position papers); studying user information-seeking behavior (e.g., Penniman, 1975; Lin, Liebscher, & Marchionini, 1991; Rice & Borgman 1983; etc.); and maximizing sales or coverage (e.g., http://www.doubleclick.com). The growth of web sites has raised this interest to new levels. There are several challenges to such analyses.
First, transaction logs for popular sites such as BLS are very unwieldy to process. The sheer volume is an impediment since it is impossible to manually process the data (e.g., printing out one month of BLS logs would take about 100,000 pages of paper). Programs must be developed and tested on subsets of data for verification.
Secondly, server logs provide an incomplete trace of each user's behavior. For example, users may jump to other sites between any BLS access and during a session may return multiple times to BLS pages already visited but these additional uses are not recorded in the server logs since the user's browser typically caches page information once it is transferred (such caching will also tend to make popular pages under-represented in the transaction logs). Furthermore, other levels of caching such as institutional or regional systems may exacerbate this problem. Additionally, other client-side behavior (e.g., mouse movement) is not included. Thus, the server logs do not offer a complete trace of user behavior.
A third challenge is distinguishing users. The logs are created on the fly and in any given minute, hundreds of requests may be logged between a single individual users' successive requests. The logs must be segmented into user sessions. This problem is complicated by the identification used in logs. The requesting machine name (IP address or DNS name) is used as the request ID. A machine may truly be an individual's machine and thus represent a single user or it may be a laboratory machine shared by many students or employees, or a proxy machine that handles all WWW activity for a company or agency. Thus, a scheme for segmentation must first be determined and even after the logs are parsed into sessions it is likely that some sessions represent multiple users.
Although these are significant challenges, we believe that systematic processing and targeted data mining offer valuable insights into how users work in a website. We took two approaches to transaction logs in this project. First, we examined the summary reports that BLS produces each month. Second, we examined individual user sessions as sequences of events and did a sequential analysis for overall usage patterns as well as for specific patterns of use.
2.2.6.1 Logs and BLS summary reports.
Standard server logs consist of entries such as this:
pt48.an4.ameritel.net - - [02/Nov/1996:09:51:54 -0500] "GET /blshome.gif
HTTP/1.0" 200 45725
205.167.6.186 - - [02/Nov/1996:09:51:55 -0500] "GET /oco/ocoban.gif
HTTP/1.0" 200 17795
pt48.an4.ameritel.net - - [02/Nov/1996:09:52:06 -0500] "GET /cgi-bin/imagemap/blshome?109,187
HTTP/1.0" 302 57
205.167.6.186 - - [02/Nov/1996:09:52:06 -0500] "GET /surveys.gif HTTP/1.0"
200 1374
205.167.6.186 - - [02/Nov/1996:09:52:06 -0500] "GET /opbhome.gif HTTP/1.0"
200 2418
205.167.6.186 - - [02/Nov/1996:09:52:06 -0500] "GET /backhome.gif HTTP/1.0"
200 2277
pt48.an4.ameritel.net - - [02/Nov/1996:09:52:06 -0500] "GET /infohome.htm
HTTP/1.0" 200 833
pt48.an4.ameritel.net - - [02/Nov/1996:09:52:07 -0500] "GET /backhome.gif
HTTP/1.0" 200 2277
pt48.an4.ameritel.net - - [02/Nov/1996:09:52:14 -0500] "GET /infomenu.gif
HTTP/1.0" 200 24576
pt48.an4.ameritel.net - - [02/Nov/1996:09:52:14 -0500] "GET /infoban.gif
HTTP/1.0" 200 18016
cust49.max3.los-angeles.ca.ms.uu.net - - [02/Nov/1996:09:52:20 -0500]
"GET /ceshome.htm HTTP/1.0" 200 2232
205.167.6.186 - - [02/Nov/1996:09:52:22 -0500] "GET /oco/oco0002.htm
HTTP/1.0" 200 1641
pt48.an4.ameritel.net - - [02/Nov/1996:09:52:22 -0500] "GET /cgi-bin/imagemap/blshome?121,57
HTTP/1.0" 302 57
uwfts1-7.firn.edu - - [02/Nov/1996:09:52:22 -0500] "GET /blshome.html
HTTP/1.0" 200 1036
pt48.an4.ameritel.net - - [02/Nov/1996:09:52:22 -0500] "GET /datahome.htm
HTTP/1.0" 200 3230
pt48.an4.ameritel.net - - [02/Nov/1996:09:52:25 -0500] "GET /backhome.gif
HTTP/1.0" 200 2277
cust49.max3.los-angeles.ca.ms.uu.net - - [02/Nov/1996:09:52:29 -0500]
"GET /cesban.gif HTTP/1.0" 200 18220
pt48.an4.ameritel.net - - [02/Nov/1996:09:52:33 -0500] "GET /databan.gif
HTTP/1.0" 200 17585
uwfts1-7.firn.edu - - [02/Nov/1996:09:52:36 -0500] "GET /blsban.gif
HTTP/1.0" 200 21016
www-r9.proxy.aol.com - - [02/Nov/1996:09:52:45 -0500] "GET /news.release/ecec.t06.htm
HTTP/1.0"
Using the first record as an example, the records provide the hostname or IP address (pt48.an4.ameritel.net), the time (November 2, 1996 at 9:51:54 am), the request (an HTML request for the BLS home page), the status code of the request (200 is satisfactory request), and the number of bytes transferred (45725). These log files are very large (the October file was about 200Mb) and represent the 958,887 requests for that 29 day period. These files are the basis for the customized sequential log analysis conducted for this project and described in section 2.2.6.2. Most servers also provide some summary reports that help webmasters monitor and maintain aggregate site activity. BLS staff create the following report files each month:
cgi.txt logs of requests that launch some cgi program on the server. In the December log, this file was 2.4Mb. It contains statistics on the number of requests made that launch cgi programs (e.g., keyword search, selective access, series reports, and most requested series). The frequency of each unique request is contained in the report. For example
0 5 5 /cgi-bin/keyword.pl?Gross+Product+Development
indicates that there were five keyword searches for the term "Gross Product Development" with this exact spelling and capitalization used. None of these requests came from within BLS, 5 requests came from outside BLS and there were a total of five requests.
flat.txt logs of requests through FTP and Gopher sites. These files were not considered in this analysis. For December, this file was 179K.
htm.txt This file contains statistics on the number of requests made for HTML documents (pages). For December, this file was 116K. The frequency of each unique request is contained in the report. For example:
40 1401 1441 /790home.htm
0 1 1 /homepage.htm
The first line shows that 1441 requests were made for the state and area current employment statistics, forty of those coming from within BLS. The second line shows there was a single request for a page that does not exist in the BLS site. It resulted in a 404 error (document not found) error for the user, but there is no indication of that in the summary report. It may be useful to add a routine that labels such nonexistent pages in the reports. Frequently occurring errors could then be remedied by the system (e.g., most BLS page names use .htm rather than .html extensions and it may be useful to provide a filter that treats .htm and .html requests equally.
misc.txt This file contains a variety of summary data. It was not considered in this analysis. For December, the file was 185K.
hosts.txt This file contains statistics on machines accessing any of the BLS servers broken down by domain.
Sets of these files were obtained from BLS for the months of December 1996 and March 1997. These summary reports were used to determine which pages get the most activity, what types of keyword searches were conducted, and how many different hosts accessed the site. A comparison of summary usage was made between the two periods to determine whether there were changes in usage patterns.
2.2.6.2 Sequential Log Analysis.
To investigate sequential patterns of use, one month's BLS raw transaction
logs (October 1996) were processed using the following procedure:
1. Transfer log file. The raw server log file was transferred via FTP to a Sun workstation at the University of Maryland.
2. Develop C programs to separate the raw log file into files in separate directories for different domains (com, edu, gov, IP, net, and other), delete GIF transfer requests, and to segment files into sessions. We chose a one-hour inactivity interval (between requests made from the same address) as the bounding condition for session segmentation. This decision needs empirical validation in future work.
3. Develop coding scheme to map specific BLS page addresses to the event codes We planned to use the Sequence Statistical Package to look for patterns in the data. Sequence limits event codes to a single character. Based upon our experience with the structure of the BLS site and examination of the summary statistical data for HTML requests, we developed a 57 code scheme for BLS pages and other states such as cgi requests and other requests. The coding scheme is presented in Table 2.2.6.1.
Table 2.2.6.1 BLS Coding Scheme
Each "session" will consist of the following:
sequence size, cluster, agreement, startdate, ID, domain, month,
day, carriage return Event1, Event2, .... Event N, carriage return
All sequence elements are delimited by spaces. If any sequence exceeds
255 characters, a carriage return is used as line continuation in place
of a space.
sequence size is the number of events (moves/pages) in the sequence
cluster is always 0
agreement is always -1
startdate is 0
ID is a whole number between 0 and 999999 identifying the sequence
(based on file name or IP address?)
domain is a whole number between 0 and 125. 1=ip address, 2=.edu, 3=.com,
4=.gov, 5=.net, 6=other country
month is a whole number between 0 and 13
day is a whole number between 0 and 32
Event is a single character code from list below followed by a forward slash (/) and the number of seconds that have passed since the beginning of the sequence; e.g., F/146 means occupational handbook home page 146 seconds into the session. Thus, first event will have time code 0, and the time spent in state S will be difference between time code for S and S+1.
Sequence event CODE URL Page
0 GET /blshome.html main menu
0 GET / [blank entry] (i.e., "GET /HTTP/1.0" 200 3390 has no path,
is the home page default)
1 GET /datahome.htm data
2 GET /eag.table.html economy at a glance
3 GET /cgi-bin/keyword.pl keyword search
4 GET /proghome.htm surveys and programs
5 GET /opbhome.htm publications
6 GET /regnhome.htm regional info
7 GET /infohome.htm BLS info
8 GET /orehome.htm research papers
9 GET /feedback.htm feedback
A GET /top20.html most requested series
B GET /sahome.html selective access
C GET /newsrels.htm news releases
D GET /cgi-bin/srgate* series report
F GET /ocohome.htm Occup. Outlook Handbk
G GET /opbinfo.htm publications
H GET /ro1home.htm I-Boston
I GET /ro2home.htm II-New York
J GET /ro3home.htm III-Philadelphia
K GET /ro4home.htm IV-Atlanta
L GET /ro5home.htm V-Chicago
M GET /ro6home.htm VI-Dallas
N GET /ro7home.htm VII&VIII-Kansas City
O GET /ro9home.htm IX&X-San Francisco
P GET /blsmissn.htm mission statement
Q GET /oreother.htm other stat sites
R GET /orefell.htm fellowships
S GET /blsorg.htm senior mgmt
T GET /inthome.htm international training
U GET /prohome.htm procurements
V GET /oreschfm.htm search BLS info
W GET /hlp* any help
X GET / missing or ambiguous entry
Y GET /cgi-imagemap/* any image map selection
Z GET /all other codes not listed
a GET /cgi-bin/surveymost most req series navigation
b GET /cgi-bin/surveymost?r* most req series choice-region
c GET /cgi-bin/surveymost?* most req series choice-other
d GET /cgi-bin/dsrv* selective access choice
e GET /*_warn* most req series or sel access warning
f GET /news.release/cpi* newsrelease cpi
g GET /news.release/disp* newsrelease disp
h GET /news.release/ecec* newsrelease ecec
i GET /news.release/eci* newsrelease eci
j GET /news.release/ecopro newsrelease econ prod
k GET /news.release/empsit* newsrelease empsit
l GET /news.release/laus* newsrelease laus
m GET /news.release/ppi* newsrelease ppi
n GET /news.release/prod* newsrelease prod
o GET /news.release/wkyeng* newsrelease
p GET /news.release/ximpim* newsrelease
q GET /special.requests* econ at a glance graphs & other special
reqs
s GET /cgi-bin/cocsearch.pl occ handbook keyword search
t GET /oco/oco* occ handbook other
u GET /emphome.htm occ handbook employment projections
v POST /cgi-bin/dsrv* Requests for selective access
w POST /cgi-bin/surveymost* Requests for series
x POST /* Other requests
Notes:
* in a URL is a wildcard character for one or more characters in both
pre and post positions
A single code for all types of help (hlp* is coded to W)
A single code for all "other" pages (coded to Z)
A single code for all clicks on menu images/icons (cgi-bin/imagemap/*
is coded to Y)
A single code for all selective access GETs (GET cgi-bin/dsrv* is coded
to d)
A single code for all selective access POSTs (POST cgi-bin/dsrv* is
coded to v)
A single code for all most requested series GETs (GET cgi-bin/surevymost?*
coded to b)
A single code for all most requested series POSTs (POST cgi-bin/surveymost*
is coded to w)
code 0 used for 2 entries
code e has left and right truncation
code x must be checked for AFTER codes v and w
The Sequence Program option used in the program requires that
each event is a single character code from list below followed by a forward
slash (/) and the number of seconds that have passed since the beginning
of the sequence; e.g., F/146 means occupational handbook home page 146
seconds into the session. Thus, the first
event will have time code 0, and the time spent in state S will be
the difference between the time codes for S and S+1. The coded record for
a sample session look like this:
1/0000 Y/0019 A/0020 c/0096 c/0113 c /0132 Y/0213 C/0213 X/0272 X/1015 0/1065 Y/1085 3/1086 X/1096 X/1120 X/1227
For each session so coded, header information was added that includes: ID (a unique number assigned incrementally as processing progressed--a number was required as Sequence does not allow alphanumeric variable values); domain code; month, day, and total time of the session. The Sequence Program automatically adds a value for the number of events in a sequence.
4. Develop C program to map raw log session files onto the coding scheme. This program was then used to create a file for each domain category that could be read by Sequence.
5. Use the Sequence program to explore usage patterns, i.e., sequential analyses rather than summary analysis.
This methodology was created specifically for the BLS site. We have attempted to make the procedure generic for any site and have used modular coding for the C programs to make it feasible for a different coding scheme to be substituted. Much of the effort went into processing the data for importation into the Sequence program. As other sequential statistical packages become available, it may be beneficial to reconsider the coding scheme if more descriptive and extensive codes are possible (e.g., using the IP address as identifier rather than an integer, coding hundreds of pages rather than 54, etc.). Nonetheless, we believe that BLS can adopt the summary log analysis techniques immediately and begin to use the sequential analysis techniques to better monitor and manage the site.
2.3 Summary and Recommendations
As this section of the report has detailed, the methods used in
this study were exploratory in nature. The employment of these methods
enabled us to further our understanding of the research questions we asked
as well as of the appropriateness of these methods for general use in this
context. Given the methodological understandings developed, we believe
that the methods we have employed are useful for website evaluation, and
should be easy to adopt and extend for each particular website. Thus we
recommend:
3 The Fedstats Website: Findings, Analysis, And Recommendations
This section of the report concerns itself with the data collection and analysis activities specific to the FedStats Website. It reviews the data collection activities, rationales for their use, presents findings from each activity and a summarized list of key findings, and discusses the implications of these findings for our understanding of users and usage of statistical data in electronic format, methodological aspects, and system design.
3.1 Data Collection Activities
In section 2, the data collection activities employed throughout the study were summarized, including those specific to the FedStats site. Details about the methods used may be found in that section.
Overview of and Rationale for Methods. The data collection methods employed during the investigation of the FedStats site were designed based on several features of the FedStats project. When the study began, FedStats was not available for the public (in that its availability had not been announced) and thus the study team had no set of site users from which to gather data. Thus we relied on the insights and expertise of the FedStats task force to help us understand the goal of the site, the potential users, and significant system design issues. We met with the Task Force and also surveyed them via an electronic questionnaire (Appendix 2-2).
Recognizing that staff in the various agencies represented in FedStats already worked extensively with the public, addressing queries via email, phone, fax, and mail, we gathered data from these staff about existing users and user tasks via an online questionnaire (Appendix 2-3) in order to use the results to extrapolate to potential users of the new site. An additional strategy aimed at developing an understanding of possible site users and their tasks was the use of focus groups conducted with users/intermediaries of federal statistics. We specifically attempted to identify people who not only were probable users of these statistics but also who had specific job related responsibilities of working with other users who had need for statistics. Thus focus group members included librarians, analysts at research agencies, etc.
Prior to the site's official availability (May 22, 1997), we also performed a series of usability tests with potential users of the site in order to provide specific system design recommendations.
In the last month of the project after the site was officially announced and publicized, we were also able to gather some data about actual site use via the online comment form on the site. While we weren't able to do a detailed analysis of these comments, we were able to form an impression of the types of questions/comments offered by these early users.
These activities were designed to answer the study questions for the FedStats site. As a reminder, these questions were:
1.What categories of information seekers use (or would use) the site?
2.What are the tasks (or goals) in which these information seekers
are engaged?
3.What strategies are employed by information seekers as they use the
site?
4.What are the design implications for the site of answers to the previous
questions?
In reviewing the findings and their implications, it is important to bear in mind the changes that occurred in the site during the course of the study. Table 3.1.1 coordinates specific data collection activities, with site changes which impact results of the various activities.
(INSERT TABLE 3.1.1 HERE)
3.2.1 Interviews with Members of the FedStats Taskforce. The online questionnaire was distributed to the FedStats taskforce in January 1997. All members of the taskforce responded, with 2 members indicating that they did not interact with the public and were on the taskforce for specific reasons and thus were not able to answer the questionnaire questions. Verbatim responses (in some cases slightly summarized) are presented as Appendix 3-1.
A wide variety of audience types for the site were suggested by the taskforce members in response to the question: What audiences would you consider to be primary groups to be served by OSS [One Stop Shopping -- the earlier name of the FedStats site]? The many types mentioned can be grouped into several major categories. These are: the general public, or perhaps more specifically people who are not regular users of statistics who are looking for statistics for personal, rather than work reasons; business users; the media; government users (down to the local level); students and teachers; researchers; staff in Federal statistical agencies; and staff in libraries/museums and other non-profit organizations.
In response to the questions, What activities do you anticipate them engaging in at the OSS? What questions/tasks do you think users will bring to OSS? there was again a wide range of answers but a set which could be grouped into several categories. These categories of use were: general topical questions, questions about whether data are available, questions looking for a specific number, questions to prove/disprove a point, questions with a geographic focus, and more broad questions such as requesting general education or referral.
The remainder of the questions on the questionnaire were intended to tap into the taskforce's perceptions of the site goals, site organization and structure, and the issues which might need to be addressed as the site developed.
Questions 3 and 4 on the questionnaire asked respondents to comment on the types of information that should be accessible via the site (q. 4) or on the site (q.3). Since the site has the primary goal of being a locator system, a distinction is possible between data actually on the site versus information available through the site. Not surprisingly, since the taskforce has been the architect of the site, there was a general consensus that data on the site should be limited to links to information, general information about Federal statistics programs and various searching and navigation tools, while the individual agency sites would be where actual statistics and associated metadata would be available.
Questions 5 through 8 asked respondents to comment on site design, asking for possible suggestions for additional organizational structures for the site (q. 5), the best thing about the site (q. 6), the worst thing (q. 7) and possible improvements (q.8). Respondents provided information related to all these questions at various places in the four questions so both here and in the summarization (appendix 3-1), these have been reorganized.
The two answers provided to question 5 were to include keyword searching of the various agency sites, as well as keyword searching of the FedStats site.
Each respondent highlighted different best and worst things. Best things about the site included the ability to get feedback from users, the convenience of the comprehensive list of agencies, possibility of creating a greater awareness of the Federal Statistics Program, providing a service to citizens, and the A-Z subject function of the site. Worst things included need to provide access to more than the Statistical Abstract of the U.S., lack of a significant feedback mechanism, development and maintenance time, the perception in some agencies that the FedStats site is a threat, lack of inclusion of the Federal Reserve, slow speed, and a potential for inadequate numbers of support staff.
Related to these comments, were the responses to the question about how to improve the site. A wide variety of suggestions were made. Mentioned by several respondents were: mechanism to collect user feedback, ability of site to parse complex user queries, tools that would allow users to integrate data across agencies and query by topic, historical or geographic focus. Also mentioned were the provision of a discussion list, analysis of usage statistics, customized extractions, include definitional, methodological, and analytical narratives along with the data returned in response to a query, access to more (and more current) statistics, user input into site organization, and working with agencies to develop standard practices of dissemination.
Throughout the questionnaire (but most particularly associated with responses to questions 5-8) were a number of comments concerning issues that organizers (and various agency personnel) may need to address. One person commented that he various taxonomies used by agencies will make it difficult to guide users to the most appropriate data sources. The same respondent indicated that the different geographic splits, different definitions of occupations, minorities, etc. will also make it difficult for users. Another respondent indicated that the site may serve to increase awareness of those differences. One person indicated a concern about the amount of feedback the taskforce will be able to get. Finally, a concern was mentioned about the amount of resources necessary to maintain the site (particularly if it remains largely manual maintenance).
3.2.2 Online Questionnaire to Agency Staff. During January 1997, staff in various agencies represented on the FedStats site received an online questionnaire. Potential respondents (and their email addresses) were identified by members of the FedStats taskforce. A total of 15 specific names were provided to the study team, 11 of these people responded to the survey. The questionnaire design followed the interview schedule used with the BLS/CPS staff with the addition of several questions specific to the FedStats site. The survey questions and answers are reported in Appendix 3-2. Respondents were asked to identify the agency in which they worked. Of the 11 respondents, 2 worked for the Bureau of Economic Analysis, and 3 each worked at the Bureau of Labor Statistics, the National Science Foundation, and the National Energy Information Center.
In response to the first question, many types of users were indicated. A review of these answers led to a sense that the same types of users were being mentioned by these respondents as we had found in previous activities. Thus, respondents mentioned researchers, students and teachers, business users, the media, government users, the general public, staff in Federal statistical agencies, librarians, and staff of non-profit organizations. New types of users included foreign persons (both researchers and government users), statisticians, international research and trade organizations, and job seekers. There was only a small overlap in specific terms used in the answers. Respondents either used different terms for the same group or provided different groups.
Question two asked respondents to indicate the type of questions asked. Again a wide range of answers was provided. These responses could be categorized into requests for:
Some specific questions were given as responses to this question such as:
survey numbers broken down by industry (NSF)
The following question asked about the tasks in which users were engaged. Not surprisingly the range of responses was again large. There were approximately 33 answers which were grouped into 11 slightly more general categories as follows:
When asked to consider what groups might not being making use of their data but could, in general, the respondents who answered the question indicated that while there probably were some groups, the reason for non-use could be lack of awareness or knowledge of how to use. Some specific groups were mentioned such as students, older Americans, and business people.
A series of questions was asked to better understand the analysts' jobs. The first question asked about what kinds of information they were responsible for providing help. The responses ranged from "everything provided by BEA" to specific program areas within an agency (e.g., electricity and nuclear related information). Some respondents mentioned that they provided information about use of technologies.
Information about the tools analysts use was also solicited. Agency databases and publications, directories, the Internet, and industry sources were all mentioned. Analysts used internal information, other government information, and external sources.
When asked how the public contacted them, not surprisingly the respondents indicated mail, phone, fax, email, in-person, and website feedback. Some differences in the use of the different modes of communication were noticed by analysts. Some channels are used more frequently than others. All analysts who answered the question reported the phone as the primary mode of contact. There was not much overlap in the answers.
General comments offered by respondents about their job centered on their roles as intermediaries and public service staff. One person indicated that one tries to remain polite, accommodating, and helpful. Interaction with customers also led to more specifically defined queries. One person expressed concern that the agency wasn't able to adequately address all the questions "out there."
While only one person had used the FedStats site at the time of the questionnaire, a range of suggestions were made. These were (all suggestions included):
As with the responses to the online interviews, the respondents in the focus groups identified a wide range of user types that they helped. The categories of user mentioned included: the general public ("all kinds of users of government information" as one respondent put it) business users, students and teachers, and researchers from federal agencies (in particular BLS and the Census Dept.) and non profit organizations. In addition to these categories, several unique categories were mentioned in the focus groups. In focus group 2, there was agreement that many users could fit into a categorization of "sophisticated (statistics) users with technical skills, sophisticated users without technical skills, non-sophisticated users without technical skills, non-sophisticated people who want to get sophisticated." In all the focus groups, at least one person responded only to requests from members of the organization of which he or she was a part. Two other categories of user mentioned in the focus groups were people who had been referred to them from somewhere else or people "who don't know where to turn."
These users were reported as having a wide range of needs and a wide range of statistics they wanted with respect to those needs.
Needs mentioned were:
comparisons (2 groups),
locator information (e.g. which person should I call, what agency has
X data), market intelligence and trend tracking (3 groups),
determination of how many/how much of something (3 groups),
learning about occupations and career opportunities (3 groups),
looking for relocation information (3 groups),
planning tasks,
writing grants (2 groups),
doing reports,
estimates of statistics or projections,
assessing the economic well being of state or region.
The variety of topics on which statistics were wanted was also varied according to the groups. Categories of topics include:
The respondents reported that they and their users wanted data from a wide variety of Federal Agencies including agencies affiliated with the Federal Statistics Program as well as other non-affiliated agencies. In addition, they also relied on commercial providers of data (if they could afford to), as well as locally produced or concatenated sets of data. Respondents had a wealth of sources at their disposal. In the first focus group, for example, everyone had used everyone else as a referral in the past. These respondents were generally well tied to the data collection and dissemination agencies at the regional and state level. Some were not, however, and at least one person thanked the interviewer for holding the focus group because she had learned so much about what other agencies had available. They seemed to employ these local connections quite often in response to client needs.
Topic, geography and time were dimensions of statistics that seemed to be important to the focus groups in terms of distinguishing between user needs. The groups indicated that many of their users wanted local data and would take higher aggregations (state, region, national) if local data were not available. The need for current as well as historical data was mentioned and there was some suggestion made that this was one way to distinguish between questions.
The focus groups also reported on user expectations. These can be summarized as "users expect to be able to get the exact information they want in the exact form that they want for the current year." and "users will frame queries in terms of what they think they can get rather than what they actual want."
As intermediaries, the respondents reported on activities they performed for their users. They may find specific data for people, help people use data (either in terms of technical aspects such as downloading or content aspects (such as metadata, methodology, or interpretation), identify people/agencies or other sources to direct the person to, educate their users about data collection strategies employed and how statistics were calculated, or analyze data for users.
The focus groups were asked to consider what a site designed to support the location and access of statistics might include. An extensive assortment of suggestions was made. These can be categorized into several areas (all suggestions are listed):
look of pages: uncluttered, simple
The groups also mentioned issues that made using statistics challenging. The differing data collection methods, definitions and formulas were recognized as possible barriers to easy use by the general public and to aggregating data across agencies.
3.2.4 Usability Tests. Three usability tests of the site were conducted in March and May 1997. Details of the tests are described in the Methodology section of the report. Summaries of data collection instruments are included as Appendix 3-4. Analysis of the results included tabulations and calculation of associated means for the usability questionnaire, summarization of the answers and comments from the scenario worksheets, and the searching of the transcripts for information related to the research questions and for the identification of other important themes related to site use and usability. As was previously stated, respondents' use of the system itself was not recorded, thus we present no findings related to actual use of the system. By asking respondents to comment on their experiences generally (rather than recording their keystrokes), we are able to gain a more general picture of their use and higher level system design recommendations.
3.2.4.1 The Usability Questionnaire. The usability questionnaire asked first about frequency of use of the Web in general and for finding statistical information. 10 of the 17 participants used the Web at least once daily and 5 used it at least once a week. Only 2 respondents used it less frequently. Everyone had used the Web at least a few times to look for statistical data but only 4 respondents used in on a daily basis. Potential respondents were screened for web use (only those with web experience were included in the sample)and for some knowledge of statistics though not for usage of the Web for finding statistics.
Table 3.2.4.1 reports the results of the usability questionnaire. Respondents reported perceived success in scenario completion. The averages of the scores were above the scale's midpoint (3) except for group 1's results for the third (individually chosen scenario). This result may be due to the fact that the search feature was not operational on FedStats at the time of the test. Average scores on overall reaction to the site measures, differed greatly between group 1 and groups 2 and 3. As a group, Group 1 gave the site higher scores on all measures, in some cases markedly so. For example, on the terrible/wonderful scale, Group 1's average was 6.29 while Groups 2 and 3's averages were 3.5 and 3.833 respectively. Group 1's score is above the midpoint on the numerical scale (1 to 9) while 2 and 3's are below. This pattern holds for all the measures in this section of the questionnaire.
Average scores are more consistent across the three groups in the section on screens. All average scores on all questions are above the midpoint of the scale and range from a low of 6.25 (Group 2 - helpfulness scale) to a high of 8.5 (groups 2 and 3 --ease of returning to previous screen scale).
Terminology questions also had Group averages above the midpoints on all scales for all groups and again are reasonably consistent across all the groups. The only area where less satisfaction was reported was in error messages (with averages ranging from 4-5). However, many respondents marked "not applicable" on that question perhaps because no error messages were received.
Consistency is also evident in the final section of the questionnaire, questions related to learning the system. Group averages were above the midpoints on all scales for all groups, ranging from a low of 6 (group 2 - getting started scale) to a high of 8.33 (group 2 - clarity of instructions scale) Aside from the anomalous results concerning overall reactions, the more specific measures indicate that respondents found the site usable. The low average scores for groups 2 and 3 on the overall measures are a bit mystifying given that higher scores on the other metrics and also given the addition, at that point, of the keyword search functionality.
Table 3.2.4.1: Results of Usability Questionnaire
| Averages | ||||
| Background Questions | 3/28 | 5/19 | 5/27 | Total |
| Please rate how successful you thought your search was for the information
in Scenario 1?
1-5 Scale Not at all successful/Completely Successful |
4.86 | 5 | 3.5 | 4.45 |
| In Scenario 2? | 4.71 | 3.25 | 4.33 | 4.10 |
| In Scenario 3? | 2.57 | 4 | 4 | 3.41 |
| Overall User Reactions to WebSite 1-9 Scale | ||||
| - Terrible/Wonderful | 6.29 | 3.5 | 3.833 | 4.76 |
| -Frustrating/Satisfying | 5.57 | 3.5 | 3.67 | 4.44 |
| - Dull/Stimulating | not asked | 2.67 (1 NA) | 3.9 (1 NA) | 3.29 |
| - Difficult/Easy | 7.57 | 4 | 4.33 | 5.59 |
| - Inadequate/Adequate Information | 5.71 | 3.5 | 3.25 | 4.32 |
| - Rigid/Flexible | 4.57 | 3.67 (1 NA) | 3.5 (1 NA) | 3.9 |
| Screens 1-9 Scale | ||||
| Were the screen layouts - Unhelpful/Helpful | 7.57 | 6.25 | 7.167 | 7.12 |
| Sequence of Screens - Confusing/Clear | 7.83 (1 NA) | 7.25 | 6.833 | 7.31 |
| Going back to previous screen - Impossible/Easy | 7.57 | 8.5 | 8.5 | 8.12 |
| Terminology & System Information 1-9 Scale | ||||
| 1. Use of terms throughout the system - Inconsistent/Consistent | 8.17
(1 NA) |
8.5 | 7.5 | 8 |
| 2. Does the terminology relate well to the work you are doing - Unrelated/ Well Related | 7.5
(1 NA) |
8.33
(1 NA) |
8 | 7.8 |
| 3. Computer terminology is used - Too frequently/Appropriately | 8.29 | 8.67 | 8.2 | 8.33 |
| 4. Position of messages which appear on the screen - Inconsistent/Consistent | 7.57 | 6.5 | 7.67 | 7.35 |
| 5. Instructions or choices that appear on the screen are - Confusing/Clear | 7.29 | 6 | 7.833 | 7.18 |
| 6. Performing an operation leads to a predictable result - Never/Always | 5.14 | 5.5 | 5.67 | 5.41 |
| 7. Relevance of individual screens to overall task - Confusing/Clear | 6.14 | 6.75 | 6.8 (1 NA) | 6.5 |
| 8. Error Messages - Unhelpful/Helpful | 4 (3 NAs) | 4 (3 NAs) | 5 (3 NAs) | 4.38 |
| Learning 1-9 Scale | ||||
| 1. Learning to navigate the system - Difficult/Easy | 7.29 | 6.5 | 7.67 | 7.24 |
| 2. Getting started - Difficult/Easy | 7 | 6 | 8 | 7.12 |
| 3. Learning advanced features - Difficult/Easy | 5.75 (3NAs) | 7.33 | 7.67 (3 NAs) | 6.8 |
| 4. Time to learn - Slow/Fast | 7.43 | 7 | 6.2 (1 NA) | 6.94 |
| 5. Instructions and help pages - Confusing/Clear | 7.14 | 8.33 | 7 (1 NA) | 7.33 |
3.2.4.2 Scenario Worksheets. Respondents were given worksheets with the scenarios and room to write down answers and comments about the scenario. These answers were tabulated and are available in the Appendix. All results reported here represent only those respondents who filled out the worksheets. Group 1 was the most diligent in writing down answers.
Respondents generally were able to answer scenario one successfully. They all found definitions of employment, generally in the relevant BLS publication. Average weekly earnings were also generally accurately reported though when asked how current the statistics were some people responded third quarter 1996, while other responded fourth quarter. They were actually fourth quarter 1996 but the title link of the page indicated third quarter.
Scenario 2 asked people to identify agencies that they would investigate for information about the state of the economy (at the national level). A variety of agencies were listed. As non-experts, the study team was unable to verify the appropriateness of the agencies listed. Experts may wish to look at these answers to develop a sense of this set of respondents understanding of appropriate agencies.
Finally, the respondents were asked to generate scenarios of their own to search. The scenarios ranged from requests for specific numbers or answers (eg., what state would stand to gain the most from a sudden increase in demand in quartz crystal) to general topic searches. No one in the group looked for a specific statistic by name.
3.2.4.3 Post-search Debriefing. The core of the usability test results are found in the analysis of the transcripts of the debriefing. These were analyzed to find information relating to the specific research questions as well as for any additional important themes.
Research Question 1 which seeks to identify types of users was not addressed by the usability test. Respondents were not asked to comment on users and did not do so. Question 2 concerns the tasks of users. The usability tests also do not provide much information for this question as respondents worked on tasks set by the researchers. In groups 1 and 2, the interviewers asked respondents to consider what the site might be good for, and respondents indicated that it would be good if you didn't know what agency you wanted (G1) though in contrast it was also mentioned that is was good if you did know what agency (ies) you wanted but less good if you didn't know (G2). It was also indicated that the site would be good for general questions where you didn't already have a specific answer in mind because you could find new things that you didn't know about (G1). Group 3 did not discuss tasks.
Research Question 3 concerns the strategies used by people. For the first scenario (on the definition of unemployment and average weekly earnings), people used the A-Z feature (G1), the search function (G2, G3), and their knowledge of likely agencies (knew that BLS would likely have that answer, then used agency page to go there). Group 1 did not have the search function available to them. Based on the comments, it seemed that all approaches were successful. Scenario 2 was more unspecific and people correspondingly had some different strategies. Some people scanned the list of agencies available via the Agency page, and went back and forth among agency home pages looking at what each agency offered. One person (G3), used the search function to find documents, looked at where the documents were located and used that as a way to generate a list of agencies. Some people in Groups 1 and 2 used the A-Z listing, looking up terms that related and seeing where the A-Z listing pointed. One person (G3) used his knowledge of agencies and started with the "Blockbuster agencies." No one made mention of using the programs page during the interviews.
In additional comments on search strategies some important points were made concerning use of the site. There was some sense that the A-Z listing was more general than the types of results returned from a search (G2) thus it would be helpful to a user to understand that distinction when trying to search. Group 2 also thought that scenario two on finding agencies would have been easier if the agency page had brief descriptions of each agency. With such descriptions, one wouldn't have to go back and forth to individual agencies to see what they have. Group 1 also discussed this from a slightly different perspective. Group 1 felt that the terms listed under each agency's homepage (when using the frame-based version of the agency page), conveyed limited senses of the agencies. The larger suggestion that was articulated in Group 2 (but to some extent existed in Group 1) as well, was that there should be more information on how to use the site For example, Group 2 pondered why the A-Z and the search button were in a different column. After the discussion on search strategies, there was an increasing awareness that they represented 2 approaches that were different from the approach offered by the agency page. One respondent commented, however, that based on his experience the "how to use the site" information provided by most sites was useful so he would ignore it).
In all three groups, good points and bad points of the site were discussed. There was a general consensus among the respondents in all three groups that having access to all these agencies in one place was a strong point of the service. The fact that the site only accessed Federal sites made it more selective, for example, than using a regular search engine so if you knew you just needed Federal information you'd get better results at FedStats than at a generic web search tool (G1). One respondent commented that having access to all the agencies was helpful even if you didn't want statistics and he might use it if he was looking for jobs in the agencies (G3). Having the Statistical Abstract was helpful though you needed to be familiar with its structure to use it since it had no search function (G1).
Also uniformly, frames were a concern across the three groups. There were complaints of not seeing enough of the content when the frame was in use (G2), and that bookmarking is complicated by frames (G1, G3) since the bookmark function of Netscape only records the frames page. Some people reported a general apathy to frames (G1).
Connection times were also mentioned as a problem (G3). Groups 1 and 2 were held prior to the actual announcement of the site.
There were complaints about particular agency pages in all groups, and there was a discussion about the consistency across agency pages in Group 2. In Group 2, someone mentioned that some of the sites seemed designed for internal use and the interviewer in Group 2 commented in response that there may be incompatibility between the goals of FedStats (access to statistics for the general public) and the goals of individual agency sites.
The A-Z listing was a topic of discussion in groups 1 and 2. No one in group 3 used the listing. For group 1, A-Z was the only subject access approach available as keyword searching was not yet available. People commented that more terms needed to be added. There was also a discussion of how the link from term to a specific page was made. One respondent seemed annoyed, commenting that the site "Funnels us away from time series" and the page linked to is "whatever some person sitting in the BLS decided is what they anticipated most of us wanted." Other respondents agreed. Part of the problem was, they decided, that the pages at the individual agencies didn't let you move up in the hierarchy or go easily to the particular agency's homepage. Thus, you felt little control over getting data that you wanted. The person who initiated this line of discussion knew that BLS had many useful time series. In Group 2, A-Z wasn't used. For some respondents it was not clear what it was. One person had the sense that A-Z was too much information so she ignored. Another person looked at the listing but thought that "it didn't seem helpful or not helpful."
In Group 1, there was a discussion both of the A-Z listing and the terms listed under agency names (on the agency page) as conveying the impression that these were the only sort of data a particular agency had. It was suggested that there be a link to an agency homepage on the agency page term lists or perhaps saying "there's more!"
A number of design recommendations were made by participants. These were:
Several other topics were covered by some of the groups. Groups 1 and 2 discussed confidence in results. This came up spontaneously in Group 1 and thus a specific question was asked in Group 2 (but not asked in Group 3). The general point of the discussion in Group 1 was that an important issue to consider is how to assure that users get accurate perceptions of the results. For example, if you get no results, is that because there is no data or because you are not searching correctly. There was a general concern that on this site, and websites in general, one is never sure whether you got what was available to get. The interviewer in Group 1 suggested that when you put in a search such as "what is the production of catfish in France" the system should be able to say: "there is no information available on that topic." Respondents in Group 2, when asked specifically about their confidence in the success said that for the scenario on unemployment it was obvious because there was a clear answer but for the other scenarios, the only measure was whether you got some good information or didn't pull up things that seemed applicable. Group 1 discussed the related issue of data quality and said that confidence was enhanced by the fact they knew the data were all produced by the federal government. Note the distinctions between user confidence in the results of their searches and their confidence in the validity of the data retrieved.
Many comments in the groups concerned individual sites. People did seem to understand when they were no longer on the FedStats site but the various individual sites did seem to affect their overall experience as indicated by the number of comments made about those sites. One person in Group 2 commented on how the individual sites were not consistent in look and feel.
Group 1 discussed the use of medians and averaging medians as well as issues relating to data complexity and whether data could be easily aggregated across agencies. They all had a good sense of the underlying issues.
It is important to note that there are inconsistencies and contradictions in the responses across the groups. Further testing should be done to validate the responses of these groups.
3.2.5 Online Comments to FedStats. Comments received on the FedStats site via the online comment form from May 22, 1997- June 5, 1997 were printed off and analyzed for major themes. Since there was not a great number of comments no attempt was made to rigorously content analyze these comments. Instead, an impressionistic sense of them was gained.
There was a total of 73 messages. The online comment form includes several yes/no questions. The tabulations for these were:
Does the site meet needs? No-21, Yes-52
Is the site easy to use? No-10, Yes-63
There are a number of other closed ended questions but they were not frequently answered in these 68 comments.
Comments were of several sorts:
testimonials 18
complaints (about speed of access, down servers) 15
corrections, relinks, errors (primarily from gov domain names) 7
suggested improvements 1
other sites/information to include (from sites not currently listed
in FEDSTATS) 9
help with a particular information need 11
can't find information wanted 2
no comment 5
other (e.g. request to publicize site) 5
It appeared that the comments relating to new sites to add asked for Federal agencies which were not members of the Federal Statistics Program. In addition, at least one correspondent failed to understand the nature of the site, She wrote "Although I found this page interesting, it wasn't relly [sic] what I was excpecting [sic]. it really is just a regurgitation of statistics....Also, the statistics that I looked at only applied to Americans. I am Canadian...."
3.3 Key Findings Of The Data Collection Activities
Key findings from the interviews with Agency Staff (including the FedStats Taskforce) are:
The data collected provide a rich picture of the potential users of FedStats, their needs and tasks, as well as some perspective on the usability of the site in its current (evolving) state. This section provides a meta-analysis of the findings of the different data collection activities, which were both complementary and orthogonal in nature (Table 2.1.1 provides a summary of activities and associated research questions.) Because of the exploratory nature of this research, we chose not to employ random sampling strategies. Instead by using a variety of purposeful sampling techniques, we were able to provide a preliminary picture of potential activity on the site, and this picture can be used to suggest future research directions. We were able to achieve redundancy in some areas of the findings (user types, tasks) and thus the findings in those areas can be considered to represent the range but not frequency of various categories.
There was a high degree of consistency concerning the types of users which might use FedStats, across the various data sources. The categories of users found were:
general public,
business users,
the media,
government users (down to the local level, national and international),
students and teachers,
researchers,
staff in Federal statistical agencies,
statisticians,
libraries/museums and other non-profit organizations.
statisticians
There were some difference in the "shorthand" used by various respondents to categorize users (journalists vs. media, school kids vs. students, etc.), we were able to categorize these users into a small number of classes by mapping direct synonyms (as perceived by the researchers) to the same category, and also mapping to the same category, cases in which some of the same words were employed. If the terms used by individual respondents were not synonyms or closely related, a new category was formed. Thus we erred on the side of making distinctions between user types. These user types also formed the general categories of users found for the BLS/CPS sites (with a few differences which will be reported in section 5).
Interestingly, there was less redundancy across the responses provided by FedStat agency analysts, than when we consider responses from all the data collection activities as a whole. This may represent differences in agency mission and culture. Thus Census might tend to get a slightly different clientele than NSF, and also have a different perspective on how to categorize and talk about these clientele.
The naming of user types by respondents may also represent a shorthand for a set of needs, tasks, or statistics wanted by a particular set of users. Thus when an analyst can report that she often helps economists, the user group "economists" may be associated with a stereotypical set of tasks that economists engage in. The work of Taylor (1991) on information use environments makes the argument that such is the case. A user's organization and role lead to a set of commonly performed tasks (and associated information needs). In the following discussion on tasks, we will return to this theme.
Respondents provided a large amount of information concerning when and why users seek statistical information. They reported this information in response to questions about user tasks, user questions, and particular agencies and statistics desired. A rich range of tasks with multiple features were reported. The study team used this information and information available from BLS/CPS data collection activities to develop a general taxonomy of user tasks. See Section 5 for discussion of the taxonomy and its possible applications to design.
As with the other findings of the study, the list of tasks represents the range and offers only limited guidance about the frequency of these tasks either across all users or for a particular group. Additional research should be conducted to understand which tasks are most commonly attempted. The provision of specific help for more common tasks could then be prioritized.
The third research question the study as a whole was designed to address concerned user strategies. The FedStat data collection activities offer some insights in this area though these must be interpreted as very limited because we were unable to capture data on "real people" engaged in their own activities on the site. Instead we have perspectives provided by intermediaries, and some data from the usability tests (limited by the fact that users engaged in scenarios developed by the researchers).
The primary finding concerning user strategies from the focus group intermediaries was that users generally were looking for local information but would "telescope up" to regional and national data if the local data were not available.
The intermediaries, themselves, may be good sources of insight into strategies employed to access and use statistical information. The agency analysts reported on a variety of tools they used including: agency databases and publications, directories, the Internet, and industry sources. The focus group intermediaries indicated that they used local, regional, and national sources in tandem. It may also be fruitful to consider how agency analysts and other intermediaries describe the questions that they receive to gain an understanding of strategies employed. Thus, one focus group respondent's comment that she could divide questions into looking for a single statistic, looking for many statistics, or looking for detailed information might be used to infer appropriate strategies.
During the usability tests, we were able to observe user interactions with FedStats in conjunction with the scenarios. Once the keyword search function was available, this was widely used for the topic questions. The agency page was used to gain a sense of the various agencies and along with the keyword search feature was a common starting point for the question related to finding agencies of interest. Respondents also commented that the agency page was helpful for gaining a sense of the assortment of Federal agencies which provide statistical data. The A-Z feature, however, was not much utilized except in the first usability test (when keyword searching was not available). Respondents made a number of comments about why it was not helpful for the scenarios. The program page was also not mentioned as helpful with accomplishing the scenarios. Of course, we must remember that the scenarios do not represent all the types of tasks we might expect users to engage in and the under-used pages might facilitate other tasks than those represented by the scenarios.
There is some evidence from studies of users on information retrieval systems, however, that users frequently employ keyword searching rather than more specific subject oriented searching (such as that offered by the A-Z listing), oftentimes because they are unclear about the differences between them or even that other options besides keyword are available. Keyword searching is a useful strategy when a subject is new and vocabulary has not been standardized. However, its use tends to provide only some of the items on a topic. (Unless a user remembers to include synonyms of terms when using keyword searching, many potentially relevant items will be missed.) Controlled vocabulary (using a thesaurus to assign terms to documents) is better at collocating items which are on the same subject but which may use different terminology. Therefore both strategies may be helpful and it will be useful to consider employment of a thesaurus for FedStats.
3.4.4 Other Important Findings
Prior to turning to the system design implications suggested by the findings (and also a consideration of explicit recommendations made by respondents), several other themes identified in the data need to be discussed.
The role of intermediaries in the statistical information seeking and use process became evident as we interviewed them. In addition to pointing users to sources, the respondents reported that they work to understand user queries (by performing reference interviews and through the use of knowledge of the domain and previous queries), help explain data collection strategies employed in the gathering of data, aid in interpretation of the statistics, provide technical assistance (downloading data, inputting in local statistical analysis software, computer based searching, etc.), and remain abreast of the existence of data sources, locally, regionally, and nationally. Additionally, they build up a network of other agencies or people to which they can refer users. The implications of intermediary expertise, for this study and further research is several-fold. The first, is that their expertise might be further mined in order to understand user behavior and the types of assistance which a system might provide. The second is that intermediaries currently form a vital link in helping users gain access to statistics and should, for the present, continue to remain involved in the process. We should also consider that the intermediaries in this study used a range of resources including non-Federal statistical information and the idea of a statistical information infrastructure that includes resources from multiple sources should be further explored.
The expectations of users represent another thread in the data. When expectations were mentioned, there was a uniform sense that users expect the data they want to be available in the form they want. Users seem to think that the Federal government has data on everything. System design may need to specifically consider these expectations--with the goal of having the expectations match the reality. One focus group respondent mentioned that users, believing that the government has all available data, may think that the government is hiding some of them, when the user can not find them through use of the site, when the reality might be, that such data are not available. One online comment to the FedStats site alludes to underlying expectations when the respondent reports being pleasantly surprised with the site.
Respondents also discussed expectations about the results received and the quality of those results. Had they found all items available? Were they receiving no hits because there were really no data or because they couldn't find it. These are not questions unique to the FedStats site; they have been generally recognized as issues for distributed, open-ended databases in general. However, they suggest that some effort should be expended in finding strategies to help users get accurate answers to such questions. Of course, agency efforts to help users develop their statistical literacy abilities may be useful in this regard as well.
3.5 System Design Recommendations and Implications
The results of the usability tests were that the respondents were generally satisfied with the site. In particular, having access to all the agencies in one place was very useful. However, the tests pointed out several areas of concern. In addition, respondents across all data collection activities provided a number of recommendations for the site.
The areas of concern which were evident from the usability tests was the limited utility of the A-Z listing (discussed earlier), the lack of information on the site itself about how to use it and what various agencies were like, and the role that individual agency sites play in how respondents perceive FedStats.
User comments about being unable to understand the purpose of A-Z, or find out how to use the keyword search function, or why a particular agency was not available points to a need to be more explicit about the nature of the site and strategies for using it successfully. Unfortunately this may be a somewhat intractable problem, as many users won't read this type of information when it is available. Thus providing this type of information in context, at the moment a user can attend to it, is worthy of further investigation. We return to a general discussion of this topic in sections 5 and 6.
Many comments made by respondents were not about the FedStats site but the individual agency sites. While users appeared to be able to recognize they were no longer on the FedStats site, they still wanted to make comments about agency sites. The same is true when one looks at the Online Comments to FedStats. It may be that the consistency across sites, and/or the "goodness" or "badness" of those individual sites will impact how people assess FedStats. An investigation into user perceptions, the variety of consistencies and inconsistencies as well as additional understanding of the organizational relationship of FedStats to agency sites, and a consideration of the various missions of these sites would be useful.
As mentioned previously, respondents offered many suggestions about site design. Since most respondents had either not used FedStats or had seen it during various early phases, these recommendations are not validated. However, they may serve as a source of insight or guidance to site developers as new enhancements are considered. It is important that specific recommendations made by individuals participating in this study be validated by more extensive testing.
The implication of all the findings for site design is that FedStats, in its role as a locator system, serves a useful purpose. Enhancements that relate to this purpose should be investigated for their utility. These include the use of a thesaurus (which also implies its use by agencies as an indexing system for their webpages), additional information about what information/sites FedStats accesses, the strategies available for access, and the provision of other tools which help users move quickly to the data appropriate for their tasks. Given this, we recommend the following activities.
Recommendations related to statistical information seeking generally:
The BLS and CPS websites were well-established at the beginning of this project. Although both sites were of interest for the project, we focused mainly on the BLS site as it serves a broader public audience. Whenever possible, the intention was to develop a set of procedures that BLS, Census, and other agencies could use on an ongoing basis for a variety of websites. As is typical with large web sites, there were several changes in organization and layout over the nine-months of study. During the investigation phase of the project, the site was mapped and a series of interviews were conducted with BLS and Census staff who use the site and respond to user questions. Based on the interviews, exploration of the sites, and discussions with the BLS steering team, electronic mail messages to the BLS Labstat service were collected and analyzed, transaction log summaries for the BLS site for December 1996 and March 1997 were compared, and BLS transaction logs for October 1996 were subjected to sequential analysis.
Based on more than eight hours of discussion with eight BLS or Census employees, a portrait of BLS/CPS site users was developed and several site development and usage themes emerged. To address research question 1, interviewees were asked to describe the types of users that use BLS data (see Appendix 2-1 for the Interview Protocol). User types vary by program area and represent the impressions of only eight individuals. The 43 types of users mentioned by the interviewees showed considerable overlap and were classified into six general categories that closely resemble those reported in Section 3. Table 4.1.1 lists the types of users mentioned by 8 interviewees and the general category to which those specific instances were assigned.
Table 4.1.1. User Types Mentioned by BLS/Census Staff
real estate clerks business users
post-doc economists researchers
students students & teachers
university researchers researchers
government users staff (including foreign) government users
retirees general public
company representatives business users
researchers researchers
trade association representatives business users
value-added resellers business users
teachers students & teachers
students students & teachers
people at home general public
press media
Congress government users
public general public
researchers (faculty and students) students & teachers
advocacy group/think tank researchers researchers
business users business users
state and local government users staff government users
researchers researchers
politicians government users
lawyers and legal aides business users
some K-12 students students & teachers
researchers researchers
government users agency personnel government users
legislators/aides government users
individuals relocating general public
agencies for fund allocation government users
researchers researchers
prisoners general public
fast food restaurant owners business users
realtors business users
employment forecasters government users
food stamp program staff government users
mortgage companies business users
politicians & campaign staff government users
warehouse owners business users
journalists media
Congress and state agencies government users
financial analysts business users
researchers researchers
general public relocating general public
As the table shows, business users were mentioned 11 times, government users 11 times, academic users 8 times, individual citizens 6 times, educational users 5 times, and media users 2 times. There was general consensus among the interviewees that although casual web surfers visited the BLS and CPS sites, they did not represent a significant portion of usage. This may indeed be the case, but the transaction log analysis suggests that many people do visit the BLS web site casually and briefly. A policy issue agencies must set is how much effort will be devoted to serving these potential users.
Interviewees noted that users come to BLS or CPS with a wide variety of needs and tasks. Of course, given that users themselves often have difficulty articulating their information needs, and the limited number of interviewees, the task types mentioned are neither mutually exclusive nor exhaustive. To provide a basis for estimating how systems might be improved to assist users in meeting their information needs, a list of tasks mentioned by interviewees was mapped onto potential ways to support those needs. This mapping is presented in Table 4.1.2. Note that these mappings are based on interview discussions and on the design experience of the project team.
Table 4.1.2. User Tasks and Support Categories
Tasks Ways to Support
questions about the web or the system system help, FAQ
specific numbers to plug into contracts or reports retrieval/point
to page
specific or specialized graphs or charts retrieval plus generation
specific codes needed for retrieval/exploration codebook/thesaurus
local data instead of aggregate data notes about what is NOT provided
help with microdata access or use instruction
additional information about data already obtained scope notes/elaboration
on metadata
verifications of data or conclusions retrieval/point to page
technical questions about methods or content statistical method documentation
research questions requiring interpretation instruction, human assistance
Many examples of these types of requests and tasks came up during the discussion of who are the users. The list above is certainly not exhaustive as it reflects the verbal impressions of only eight people. See the task table in Section 5 for aggregation across all data collection activities.
Several interviewees noted that questions about the web site or using the system itself were common but not problematic as they could be easily referred or answered, in some cases by leading users through steps online (as long as a phone line was available while users were online). It seems inevitable that multiple levels of support for system usage will be necessary as larger segments of the population acquire computers and network access. Many of the typical introductory questions novices ask are easily routed to a general help desk and many of these may be serviced through FAQ services (although these facilities must be carefully designed so that novices are not intimidated or frustrated). However, as new users become more sophisticated, the questions they bring will also grow more complex and agencies will need to develop clear policies for what level of human support is provided for potentially large numbers of complex questions not serviceable through automated means.
All the other types of requests in the table above are related to content and depend on how much users know about statistical data generally and BLS/CPS policies and procedures for collecting and disseminating such data. Users may fully understand why a specific data item is needed but not know whether BLS/CPS provides it or where it may be found. Conversely, a user may be assigned the task of routinely retrieving a specific datum without any knowledge of why or how it is used. Many users visit the site frequently and focus on specific programs or data and only require assistance when procedures or the site changes.
For focused tasks such as retrieving specific values or verifying data, good retrieval services will suffice for most users. For generating customized series or tables, services such as selective access must be made easier to use. Several interviewees noted the importance of adding data codebooks for users since there is so much data available and so many possible series or tables users may wish to generate.
Some interviewees noted that some users assume the federal data is broken down to fine local levels, they are disappointed when such data are not available. This is a classic problem for electronic systems in general and government sites in particular as users think everything is available (noted in Section 3 as well). We encountered similar problems with user expectations at the Library of Congress as the National Digital Library is developed (see the project website for papers and prototypes http://www.cs..umd.edu/projects/hcil/Research/1995/ndl.html). It is important that ways be invented to help users clearly and easily determine what is NOT at a site to head off many of the questions that take analysts time or lead to site abandonment and disenchanted citizens.
In cases where users need additional information for data already obtained or have questions about methods, scope notes for metadata or elaborations should be easily accessible. Unobtrusive interface techniques such as pull down menus can make such data accessible without annoying those who do not want it, however, first the appropriate information must be created or identified for linking.
In all these cases, better conceptual interfaces and services can help minimize the number of requests that must be handled by humans. In the case of complex or interpretive questions, humans will always be required and agency policies about degrees of assistance must be set and clearly stated.
Several themes and recommendations emerged from the interviews.
1. Web site availability increases user expectations. These expectations increase for both the volume of data as well as the speed of access. For example, one analyst noted that people who use the website to obtain specific time series not previously published now expect to be able to create new time series at will. They now need to know variable codes to do so and thus require more sophisticated support. Several interviewees noted that people expect immediate access to data in spite of the fact that verification and loading of megabytes of data is not instantaneous upon official release. One noted that value-added resellers often have such expectations and two others noted that faster loading of updates are required to meet users expectations for instant availability upon release.
2. Users need vocabulary and codebook assistance. Almost every interviewee reported that users need better support for entering search terms or specifying data codes. They noted that although many terms are defined by the existing site, they are defined using "economist" vocabulary. There are four types of terminological requirements: first, definitions for terms so that users can understand technical concepts (e.g., seasonal adjustments); second, notes about how commonly understood concepts are defined/derived (e.g., what is a family?); third, thesaural mappings for terms used in different contexts (e.g., when CPI is ok to use, when consumer price index must be used); and fourth, codebooks that help users map word concepts to variable codes.
3. Data releases stimulate requests. Interviewees noted that calls and emails are often cyclical, peaking soon after data releases. BLS can develop more anticipatory actions to accommodate this cyclical volume, for example, providing a what's new or today's releases button on the home page may help users. Of course, providing such services implies a concomitant increase in technical staff work to update and maintain the web pages (not only must new things be added, but the outdated material must be assigned to the proper location).
4. BLS/CPS human resource allocation is a common concern.
Several analysts reported activity levels in their program as more
than 1000 phone calls per month. Interviewees reported that at present
there is far greater phone activity than email activity except for LABSTAT,
where email activity was much more common (>500/month) than phone activity
(<100/month). Most noted increases in email activity since the website
became available but there was no consensus about whether in the long run
the increase in email would become a significant additional burden or would
be mitigated by a decrease in phone requests. Most interviewees did express
concern that increased web usage will lead to more demands on their time
to provide user support services. This is especially problematic for analysts
whose regular responsibilities are highly demanding and require significant
content expertise. It was noted that email, unlike phone conversations
yields retrievable documents and as such, they should reflect agency policies
and protocols. It is imperative that agency policies for the form and quality
of email support be established.
5. BLS should develop better referral procedures. Different interviewees reported a wide range of strategies for handling user calls and emails. In some program areas analysts are assigned specific time slots to answer requests, in others, one or two analysts are responsible for managing requests. In all cases, individual analysts often forward calls or emails to other analysts who have expertise in the request's topical area. Many of these forwarding decisions are made on the basis of personal relationships and knowledge. If user services grow as a result of online access, more routinized referral procedures will be needed.
6. BLS should consider creating (or linking to) statistical tutorials. One interviewee noted that when K-12 or college students pose overly general or simplistic questions they are directed to explore some web pages rather than simply given the answers- i.e., the analyst performs some educative function rather than a simple question answering function. Likewise, as individual citizen access increases (especially given the aging population with home computer access and time to explore government sites), basic statistical tutorials may be useful and, if well-designed, they could become popular.
The interviews provided an excellent entree for the project team to understand the BLS/CPS service functions and work context. The interviewees were highly skilled and service-oriented professionals. They are the agencies' most valuable resources. It is clear that high priority should be given to the development and articulation of policies and procedures that help them to continue doing their primary analytic duties (e.g., research, writing, and data interpretation), do not overburden them with customer support tasks, yet allow them to share their expertise with citizens needing help. Bluntly, they need to be protected from simplistic questions. This is no easy challenge since the user who asks a simple question must also be served in a courteous and professional manner.
The email content analysis was designed to help us understand the types of tasks that people brought to BLS/CPS and what types of problems they encountered so that website design could be improved to better anticipate user needs and mitigate possible problems. The best representation of user tasks are the questions they ask. The content analysis aimed to categorize these questions and compare them across two periods. To this end, 379 email messages that came to LABSTAT in November, 1996 were analyzed and 657 questions in those messages were coded, and 569 messages that came to LABSTAT in March 1997 were analyzed and 827 questions were coded (see Methodology section-3 for details of the coding and the pilot testing with CPS email messages).
It is important to note that although these messages represent a large volume of user data, they are self-selected users who took the time to send email. Results from this analysis must be taken into consideration in light of the other data analyses. Tables 4.2.1 and 4.2.2 summarize the number of questions that were coded into each of the categories. The columns represent a content dimension that aimed to characterize the questions by topic and the rows represent a format dimension that aimed to characterize the user question asking strategy.
(Insert Tables 4.2.1 and 4.2.2 here)
The most important result of this analysis is that the largest number of the questions in both months were in the data column, which reflects the goal and content of the site. Thus, the questions these people brought to the site were appropriate for the information contained at the site. The proportions of the What, Where and Do you have categories on the question format axis also show that most users ask for specific content (the data itself) and about half as many for the location or the existence of the data.
In both months, the most frequently asked questions types were:
-
what's the statistic (November: 29%, March: 40%),-
where the statistic could be found (November: 24%, March: 18%), and-
did the BLS have the statistic they wanted (November: 16%, March 14%).
All other question category frequencies were very small by comparison. System error reports were the 4th largest category at 6% of the questions in both months. There was no noticeable change in frequency of question types between the two months. This evidence does not indicate that there were changes in the types of users sending mail.
The largest group of questions fell into the what/data category in both months and there was also a substantial increase in this category from 29% of all questions in November 1996 to 40% of all questions in March 1997. The second most numerous group of questions was the where/data category. In this category there was a slight decrease in the number of questions between the two months. The dominance of these two categories show that users either do not look for the information but instead expect someone to send it to them, or that they looked for it but could not find the data in the website themselves.
In a 2-day period in March there were 83 messages, 34 of which contained one or more what/data type questions. 41% of these messages indicated previous searching in the database and the users asked for help with a specific problem or gave up as they could not find the data. The other 59% did not mention any previous searching for the topic. This suggests that their first step was to write for help. Both for this second group and the people who looked for the information but gave up, general help/introductions might be helpful. For the rest of the users, who asked specific questions, context sensitive help might be useful if it is easily accessible from the actual pages. Additional email analyses may suggest appropriate content for such help, especially if users can be contacted for followup or if complete sets of requestor-staff interactions can be obtained.
The high number of questions in the what/data category suggests that help that is structured by type of statistic may be warranted. Often the questions in the what/data category did not suggest previous searching at the web site. Sending mail seemed to be the first or second step in trying to locate the information right after finding the page or after looking for the information but giving up. This suggests that users are either novices to the data or to the website and do not have/take the time to explore it to find the data by themselves or when they can find it they chose to send an email to ask for the data. Better support for new users may mitigate some of these requests. More significantly, on the BLS homepage there is no help or introduction option but there is an email address to the help desk, which prompts users to send an email and ask for the data instead of exploring the site for themselves.
In reviewing the messages, it was noted that people seemed to expect free data. There was a general absence of questions concerning payment for information. Instead people supplied their home addresses or a fax number and expected the information to be sent free. Messages often indicated that they wanted the information as soon as possible, immediately, or perhaps by the end of the week. These high (and perhaps unrealistic) expectations parallel the comments made by BLS/CPS staff who were interviewed.
A more in-depth investigation of the March what/data category yielded the results summarized in Tables 4.2.3, 4.2.4, and 4.2.5. People were looking for a specific statistic instead of comprehensive or extensive data on a subject. There were twice as many messages asking for a specific number rather than more general information requests. Good search facilities are a must to help users find specific numbers in the huge volume of data at BLS/CPS sites.
Most users were interested in national level data. Sixty-eight
percent of these questions dealt with national data or at least did not
specifically mention a particular locality or region. This contrasts with
the focus group members (see Section 3) who indicated that people asked
them more for local and regional data. Perhaps people ask different questions
of different providers based on the level of data the user thinks the provider
collects: they ask national questions of national providers, local questions
of local providers. These results parallel the relatively low volume of
regional requests found in the transaction log analysis (Section 4.3).
These people wanted current data more than they wanted time series data
or a single historic piece of information. More than half of the questions
asked for a single statistic (or several single statistics) rather than
a series of data over time or a single historic statistic.
Table 4.2.3. Email Coding March 1997 -
Data/What messages
Amount: One/Many
| One | Many | Totals | |
| Employment | 74 | 46 | 120 |
| Productivity | 16 | 12 | 28 |
| Compensation | 34 | 26 | 60 |
| Prices | 27 | 8 | 35 |
| CPI | 37 | 1 | 38 |
| PPI | 13 | 0 | 13 |
| Demographics | 2 | 7 | 9 |
| Other | 16 | 11 | 27 |
| Totals | 219 | 111 | 330 |
| City | State | Regional | National | Totals | |
| Employment | 23 | 19 | 6 | 73 | 121 |
| Productivity | 1 | 1 | 1 | 25 | 28 |
| Compensation | 10 | 5 | 5 | 39 | 60 |
| Prices | 5 | 1 | 4 | 25 | 35 |
| CPI | 12 | 2 | 1 | 23 | 38 |
| PPI | 0 | 0 | 0 | 13 | 13 |
| Demographics | 1 | 1 | 0 | 7 | 9 |
| Other | 5 | 3 | 1 | 18 | 26 |
| Totals | 57 | 32 | 18 | 223 | 330 |
| Current | Series | Historic | Totals | |
| Employment | 70 | 35 | 15 | 120 |
| Productivity | 16 | 7 | 5 | 28 |
| Compensation | 42 | 13 | 5 | 50 |
| Prices | 16 | 15 | 4 | 35 |
| CPI | 19 | 12 | 7 | 38 |
| PPI | 5 | 5 | 3 | 13 |
| Demographics | 5 | 2 | 2 | 9 |
| Other | 20 | 3 | 4 | 27 |
| Totals | 183 | 92 | 45 | 330 |
Employment and compensation were the most often asked about categories of data. 37% of the questions dealt with employment in some way, and 18% of the questions dealt with compensation. This parallels the high volume of requests for employment data (along with CPI data) found in the transaction log analysis. It certainly is reasonable that users would come to a Department of Labor site for such information.
The questions in the where/data category also form an important category. Some of these questions appeared in combination with the data/what category questions asking for either the data itself or a pointer to where the user can find it. Most of these questions were preceded by searching the site, the user knew the information was there but could not find it. This category suggests that these users may be familiar with the data (e.g. I know this data exists, but I can't find it, where is it?), but not with the website. Relating the web site back to previous forms of publications in the help section might be useful for this group of users.
How/data and How/tool questions may have come from more sophisticated users. These users probably have searched the site and found data but are looking for customizing capabilities or would like to know more about the sources of the data.
Some question types seemed more complex than others. For instance in terms of the broad question content, questions about metadata seem more complex than those asking about publications because the metadata questions indicate that the user wants to understand how a particular statistic was derived and publication questions for the most part simply asked for a specific publication to be mailed to the user. In the November set, metadata questions accounted for approximately 4% of the questions and in March 5% of the questions were about metadata. Publication questions accounted for 4% in November and 3% in March. However, both of these question types were asked much less often than data questions. In terms of these data questions, those indicating errors (November: 2%, March: less than 1%) seem more complex than those asking the location of a statistic (November: 24%, March: 18%) or for a specific number (November: 29%, March: 40%). This is certainly reasonable as users need a high degree of sophistication to challenge the veracity of data.
Questions asking for a series of numbers might indicate that the user was building a time series for analysis. Users asking for many statistics on a subject might be trying to build a detailed picture of their subject. However, these types of questions were a small percentage of the total.
The email analysis generally reinforced the results from other analyses and provided specific examples of user questions and partial views of their information seeking strategies. Other factors might be studied in the email messages to help understand the complexity of the questions. It would be useful to coordinate the email requests with actual transaction logs to gain a more holistic view of user information-seeking behavior. Such coordination would likely need user permission and could also be linked to interviews or questionnaires over some period of time. It would also be interesting to compare user questions based on their background or profession. Likewise, it would be interesting to examine particular users' question asking patterns over time or look at the users who ask multiple questions to see how they are different from users who ask just a single question.
4.3. Transaction Log Analyses
Two types of transaction log analysis were conducted. First, summary
logs were examined to see aggregate BLS website usage patterns. Second,
individual session logs were coded and analyzed to determine specific usage
patterns. These analyses are presented in the following subsections.
4.3.1. BLS transaction log summaries.
Server transaction summaries are compiled each month and provide a
gross picture of user activity. These summary log reports were obtained
and compared for high-frequency selections and general patterns for November
23 to December 23, 1996 (31 days) and February 22 to March 25, 1997 (32
days). Although summaries for ftp and gopher are included at the most coarse
levels, the focus in this project was on web-based access. For the purposes
of this analysis, the Nov-December set will be referred to as the December
set and the Feb-March set as the March set. In the data below, values for
March have been adjusted by a 31/32 factor to account for the difference
in number of days. It should also be noted that the December period includes
the week immediately before the Christmas holiday when web activity was
somewhat below normal usage so growth patterns are somewhat overestimated.
The total activity for the three online services (FTP, gopher, and WWW) for the two periods is summarized in Table 4.3.1.1.
Table 4.3.1.1 BLS Online Service Activities in December 1996 and March 1997
Clearly, FTP and gopher access continue to grow, although in this single
pair comparison gopher is growing less rapidly than FTP which gets about
twice as many accesses. Web access shows the fastest rate of change and
gets about thirty times as many accesses as FTP. (If velocity of gopher=V,
and acceleration of gopher=A, then velocity of FTP~2V and acceleration~1.15*A,
and velocity of WWW~60V and acceleration~1.4A.).
It seems prudent to maintain FTP and gopher but monitor the use of gopher for possible elimination. WWW access activity increases should be carefully monitored so that BLS can plan for system upgrades (e.g., servers and telecommunications lines) to maintain timely user access. All subsequent analyses focus exclusively on web usage.
The summary reports that BLS generates each month give the total number of requests (accesses or hits) for each page. As can be seen from Table 4.3.1.1, overall website activity increased by more than 60% from December to March. Table 4.3.1.2 summarizes the activity over the two periods for the nine top level services on the BLS home page. These data do not include requests for these pages made through the cgi-bin/imagemap feature (i.e., does not include counts when users clicked on one of the images on the home page rather than the textual choices). Sequential analyses (see Section 4.3.2) suggest that about 14% of all user mouse clicks are on images so this data underestimates the total activity on the BLS home page by some significant portion (not the entire 14% since image maps clicks on other pages are included as well) of this amount on average.
The BLS homepage is clearly a key element of the BLS WWW service as it accounted for 18.8% of all hits in December and 17.1% of all hits in March (not counting the imagemap usage). The largest increase in usage was in the Publications and Research Papers where information of general interest to broad segments of the citizenry are found (e.g., the Occupational Outlook Handbook and News Releases).
Table 4.3.1.2. BLS Home Page Activity
for December 1996 and March 1997.
Another factor contributing to this increase was the Fall 1996
home page reorganization that eliminated research papers as a separate
top-level category and
moved them into the Publications and Research Papers category. There
was a significant decrease in usage of the BLS information page over this
period. This was likely due to a change that put other statistical sites
into a new top-level category and possibly to the renaming of the category
from "BLS Information" to the more specific "About BLS."
The increases in the overview or summary content areas (economy at a glance, proghome) were generally higher than those in the statistical data-rich areas (datahome, keyword search, and regnhome), which might indicate that increased volume is due to people coming to the BLS site out of general curiosity rather than with well-formulated information needs.
With few exceptions, other high volume pages showed similar increases across the two periods. Table 4.3.1.3 summarizes the usage activity across the two periods for pages that received 1000 or more requests in at least one of the months. It is sometimes obvious why some pages showed unusual activity changes (e.g., time sensitive information), but many of the larger variations may be statistical anomalies or due to system changes. This reinforces the importance of maintaining site maps on a regular basis so that such changes can be investigated in the future.
There were seven pages that showed a decrease in activity over the December to March period. The ces_warn2 page is a warning message about a decimal point problem corrected for the Current Employment Statistics in November; perhaps this warning was somewhat out-of-date in March. The dolbls page is the link to the U.S. Department of Labor home page. Two help pages received fewer requests
Table 4.3.1.3. BLS pages with more than
1000 requests
URL December March Adj March Ratio % Change Page function

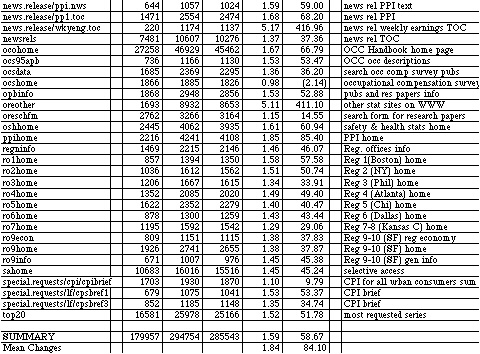
(hlpcolumn and hlptable give help on reading column formats and tables , respectively), which seems somewhat anomolous given the increases in other help page accesses. It seems reasonable that two out of date news releases would receive fewer requests over time (news.release/cpi.12396.toc and news.release/cpi.br12396.br give information on the December 3, 1996 CPI release). It is unclear why there were fewer requests for the ocshome (Occupational Compensation Survey).
There were eleven pages that received more than twice as many requests in March than in December. The BLS mission statement page (blsmissn) almost tripled in activity, which may have been due to the home page reorganization that isolated "About BLS" from the more complex "BLS Information" used in the earlier version. The importance of the CPI is evident in the increase in the CPI Overview (cpiovrw) and the news releases dealing with CPI (news.release/cpi.nws; news.release/cpi.t01; news.release/cpi.t02; news.release/cpi.t03 include news and tables). Likewise, the importance of employment data is reflected in the increases in the Employment Projections' Most Requested tables (emptab0) and Fastest Growing Occupations (emptab1). News releases of usual weekly earnings also saw a large increase (news.release/wkyeng.toc). Other statistical sites (oreother) saw a five-fold increase- likely a result of the reorganized home page that moved this page from BLS Information to About BLS.
Another way to look at overall website usage is through the logs of cgi-bin requests. Cgi-bin requests call programs that perform specialized functions, for example, creating tables on the fly. There are two main types of cgi-bin requests that received heavy usage: keyword searches and generation of customized series or tables. Table 4.3.1.4. lists the number of internal, external, and total requests for cgi-bin programs that were called more than 1000 times for December 1996 and March 1997. Overall cgi-bin requests increased 60% (very close to the 63% increase in overall website requests from Table 4.3.1.1) over this period. The most frequently accessed service was cgi-bin/dsrv, which initiates the Selective Access templates. Usage showed a 49% increase. The next most heavily used cgi-bin service was cgi-bin/surveymost, which initiates the most requested series selections. Specific series' that were requested more than 1000 times are listed in the table in indented form. Most requested series activity increased 69% from December to March. Requests for Series Reports (cgi-bin/srgate) were the next most commonly accessed service and showed a 55% increase over the period. Keyword searches in the Occupational Outlook Handbook were next most frequently used cgi-bin service (cgi bin/ocosearch.pl) and usage showed the largest percentage increase of all the cgi-bin services (88%). The next most frequently accessed service was (cgi-bin/keyword.pl), which showed a 55% increase. Keyword searches in the Occupational Compensation Survey showed a 44% increase. The keyword searches in research reports used 5234 times in the December period was discontinued in the reorganized website available in March and the Occupational Safety & Health Statistics keyword search service increased beyond the 1000 hit level in March.
Thus, hundreds of thousands of user requests for specialized searches and series are served each month with the largest increase coming in the Occupational Outlook Handbook, a general interest service often used in schools for career counseling. This increase might indicate increasing numbers of students or the general public visiting the BLS website.
A look at the most frequently occurring specific requests not only illustrates the most common topical interests of users but also raises some design suggestions. For example, there are many variations for common searches such as those for CPI. Here are some variants and the number of requests for four commonly used variants during March 1997.
1 161 162 /cgi-bin/keyword.pl?CPI
2 253 255 /cgi-bin/keyword.pl?consumer+price+index
1 116 117 /cgi-bin/keyword.pl?cost+of+living
0 273 273 /cgi-bin/keyword.pl?cpi
Other keyword search requests made more than 100 times during March include:
0 139 139 /cgi-bin/keyword.pl?inflation
0 163 163 /cgi-bin/keyword.pl?salary
0 167 167 /cgi-bin/keyword.pl?unemployment
0 123 123 /cgi-bin/keyword.pl?wages
There are a variety of misspelled requests or variant-form requests that each occurred once or a small number of times. Adding some vocabulary control facilities (e.g., equating terms and acronyms, ignoring plurals, mapping synonyms, etc.) for popular requests may help users avoid receiving no results or misleading results.
The following occupations were requested more than 100 times in keyword searches in the Occupational Outlook Handbook in December:
0 148 148 /cgi-bin/ocosearch.pl?accountant
0 105 105 /cgi-bin/ocosearch.pl?accounting
0 160 160 /cgi-bin/ocosearch.pl?computer
0 208 208 /cgi-bin/ocosearch.pl?doctor
0 157 157 /cgi-bin/ocosearch.pl?engineer
0 230 230 /cgi-bin/ocosearch.pl?lawyer
0 144 144 /cgi-bin/ocosearch.pl?librarian
0 134 134 /cgi-bin/ocosearch.pl?nurse
0 114 114 /cgi-bin/ocosearch.pl?physician
0 116 116 /cgi-bin/ocosearch.pl?psychologist
0 285 285 /cgi-bin/ocosearch.pl?teacher
Note that the logs are case sensitive and exact match, so requests for Accountant, ACCOUNTANT, and Accountants will each have separate entries in the logs and are not included in the numbers above. In the March logs, there were 38 entries with more than 100 requests. There are numerous misspelled occupations in the logs (as well as repeated "offbeat" requests, e.g., prostitute, drug dealer, etc.), likely reflecting searching by K-12 users. A more complete table of high-volume cgi-bin requests is presented in Appendix 4. Examining the most requested series, selective access templates, and surveys may also help website managers to monitor services that should be considered for promotion in the organizational hierarchy or some other specialized treatment (e.g., elimination). Other types of failure analysis may be informative for both design improvements and for thesaurus construction purposes.
Summary logs are designed to provide site managers with high level overviews of site activity. The analysis presented above is meant to suggest some ways that BLS/CPS staff can use such data to look for ways to improve site usage and user performance. A suite of summaries should be executed each month to this end.
4.3.2. Sequential log analysis.
Summary logs provide valuable information for site improvement and management, and may provide hints about aggregate user information-seeking behavior. Because we aimed to better understand user information-seeking behavior (research question #3), we created an analysis procedure that examined individual user sessions rather than only summaries of all user sessions in aggregate (see methodology section-3 for details of this technique).
It is useful to define some of the terminology used in the following discussion. A user session was determined as a set of web requests from a unique address with no more than one hour passing between requests. Thus, sessions could be days in length if a single machine was shared by many people (or a software robot) and at least one request went to BLS per hour. Due to a Sequence Program size limit, the maximum length of a session subsequently analyzed was 32750 seconds (a bit more than 9 hours). For the purposes of the Sequence Program analyses, a user session is known as a sequence. Thus, session and sequence are used interchangeably. A specific user move, hit, or request is a mouse click on a link or button that sends a request to the BLS server. For the purposes of the Sequence Program analyses, a user move is known as an event. Thus, move, hit, request, and event are used interchangeably.
A set of transaction log files for the period from October 12, 1996 to November 9, 1996 was obtained via FTP from BLS. In the tables and analysis below, this period will be referred to as the October period. The raw transaction logs (approximately 200 Mb) were first divided into 144,948 individual files that represented unique IP addresses or host names. Based on the coding scheme described in the methodology section, another program was written that read each line of each file, assigned the proper code and time value, and wrote the coded data to one of six files (one each for the .com, .edu, .gov., .ip, .net, and other domains). Because the Sequence Program we used to conduct the sequential analysis had a limit of 32750 sequences (sessions), we were unable to combine all the final files for one combined analysis. (Note: the .ip file was so large that it was divided into three separate files for the Sequence runs and then results combined for the summary analysis that follows.) These text files were then read by the Sequence Program and various analyses run. The results that follow represent high-level views of tens-of-thousands of individual sessions. Most importantly, the entire process raises a number of questions that transaction log analyses may be able to address as BLS and other agencies expand web-based public services.
The log analysis considered 171,024 sessions from 144,948 different hosts with a total of 958,887 events. Table 4.3.2.1 summarizes the activity for the six domains during this period.
Table 4.3.2.1. BLS Session Activity for October 1996.
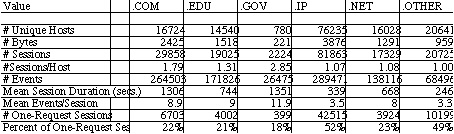
The greatest activity came from the .IP domain, which accounted for about half of all sessions. (Note that for the purpose of this report, the term "domain" is used for the six categories of user sessions. .IP and .OTHER are not true Internet domain names.) The numeric IP address is the default value used by servers if the domain name is not explicitly represented (e.g., many home users with service providers will show up this way if their Domain Name Server (DNS) is assigned dynamically by the service provider). Thus, .IP users could be anywhere in the world but typically come from machines that have not been given specific domain names by individual users or their organizational entities (e.g., LAN administrators). The .COM domain (which includes not only machines from specific businesses but also service providers such as America Online) accounted for 17% of all the sessions, the .EDU domain (which includes machines at U.S. educational institutions) accounted for 11% of all the sessions, the .NET (which includes network organizations and some Internet service provider machines) accounted for 10% of all sessions, the .GOV (which includes federal government machines) accounted for 1% of all sessions, and other domains (e.g., machines located in other countries, those with U.S. military or state/local domain names) accounted for 12% of all sessions.
The sessions per host ratio is interesting in that the .IP, .NET, and .OTHER domains have ratios near one, suggesting that most users in these domains only visited the site once during the October period. The .GOV domain has a very high ratio, suggesting that users in this domain are much more likely to be regular users (on average almost three times per month). The .COM domain shows a fairly high ratio suggesting that users in this domain on average visit the site almost twice a month. These usage patterns may be useful for offering specialized interfaces for users based only on the machine address.
There are similar difference patterns for other usage indices. The .OTHER and .IP users have much shorter sessions on average than other users. The .OTHER users only averaged about four minutes (246 seconds) per session, and the .IP users only averaged about five and a half minutes (339 seconds) per session. The .NET and .EDU users cluster together with eleven minutes (668 seconds) and twelve and a half minutes (744 seconds) per session respectively on average. It is interesting that the .GOV and .COM users cluster together for fairly long sessions, with .GOV users averaging twenty-two and a half minutes (1351 seconds) and the .COM users averaging almost twenty-two minutes (1306 seconds) on average.
These usage pattern clusters are somewhat different for the average number of events per session. As with the other indices above, the .OTHER and .IP users tend to make very few requests, averaging 3.3 and 3.5 hits per session respectively. It may be that users from other countries (included in both of these domains) may not have high-speed access and give up after a few mouse clicks. The .GOV users stand apart with almost 12 requests per session, while the .COM, .EDU, and .NET users made nine, nine, and eight requests per session on average, respectively.
Taken together, these data suggest that .GOV and .COM users tend to be the most experienced and persistent users, with .EDU and .NET users a bit less so, and .IP and .OTHER users least of all. These patterns are reinforced by the number of sessions that consist of exactly one request (i.e., the user hits the BLS site and then abandons or does not take another action at the site for more than one hour--these will be referred to as abandonments). About one-half of all the .IP and .OTHER sessions consist of exactly one request. About one-fifth of the sessions of users from the other domains are exactly one request in length, with .GOV sessions showing the lowest number of immediate abandonments.
Two recommendations for future log analysis were immediately apparent based on this analysis. First, more fine-grained parsing of the user machine would be helpful. For example, sessions from large service providers such as America Online or CompuServe in the .COM domain could be broken out and treated separately since they heavily reflect home usage rather than more typical corporate and business usage in the .COM domain. Second, it would be useful to count the number of sessions for unique domain names/IP addresses. Although this would be biased by data from users sharing a machine (e.g., in labs or public spaces), it would be useful to more carefully examine sessions at heavily used machines to inform development of more specialized interfaces and services.
Much of these data come from a series of Sequence Program analyses referred to here as Analysis 1 Runs. For this analysis, the following was done for each domain. First, a frequency table for number of events in a sequence (variable named SEQ) was generated. Next, basic statistics (range, mean, variance and standard deviation) for the number of events in a sequence and the sequence duration (variable named totime) were generated. Finally, a frequency table for each of the 57 codes was generated. The complete output from these runs is presented in Appendix 4-2.
A more fine-grained overview of usage is provided by the frequency tables for events. Table 4.3.2.2 combines the frequency tables for the six domains (three tables are given for the .IP domain reflecting the three parts of that large file). Several conclusions are immediately apparent from this data. First, the number of events coded as X or Z, which are for undefined or ambiguous events is around 15% for all domains. This means that the 57 event codes account for about 85% of all user activity. The implication is that transaction analyses may not need to do an exhaustive coding of all website pages but still yield good coverage of user behavior.
Table 4.3.2.2. here
As is reasonable, a significant amount of activity was found for the BLS home page codes (codes 1-9). The percentage of all activity devoted to these nine codes for the six domains were: 11.8% (.COM), 12.5% (.EDU), 10.3% (.GOV), 11.4% (.IP), 12.1% (.NET), and 11.8% (.OTHER). Given that the .GOV users had the lowest percentage of activity for the BLS home page (code 0) and for these home page links, it is clear that these users are more often going directly to specific pages below the opening screen than are any other user group. These actions may be effected through bookmarks or by typing in a specific location, but this result reinforces the interpretations above that .GOV users may be more sophisticated in their activity than other users.
Of the home page options, codes 1 (data) and 3 (keyword search) received the highest activity levels across all domains, with code 2 (economy at a glance) the next most frequently used. It is unclear why economy at a glance has higher volume of access than keyword search in the summary tables for December and March (Table 4.3.1.2), perhaps the summary logs undercount keyword requests since they are cgi-bin requests.
Other than the X code (page not defined in the coding scheme), the most frequent code for all domains is Y (any imagemap). Thus, 12.8% (.COM), 13.3% (.EDU), 14.1% (.GOV), 14.2% (.IP), 10.5% (.NET), and 11.9% (.OTHER) of all user requests were made by clicking on page images (e.g., the selectable graphics on pages rather than the selectable words/phrases). This is an interesting phenomenon that has two conflicting lines of inference. First, expert users may not wait for images to load and click directly on words. Second, users in corporate, educational, or government sites may have faster connections and not be as annoyed by graphics loading time delays. Since many of the experts are in such locations, this may mitigate the first hypothesis. There also may be a significant number of text-only users that influence these values. Thus, the importance of providing graphic options for users is not informed by this data and should be investigated by other methods (e.g., user studies). For sites serving experienced work-oriented information seekers, our design recommendation is to maximize useful information on a page to minimize wait time, scrolling, and page jumping. Graphics, although attractive, tend to mitigate this aim.
Another frequently used page was the selective access cgi-bin request (code v). These requests were made by 10.6% (.COM), 7% (.EDU), 11.1% (.GOV), 8.1% (.IP), 7.9% (.NET), and 6.3% (.OTHER) of the respective domain users. Once again, .GOV and .COM users were more likely to use this somewhat sophisticated customized data retrieval and display service. Selective access is a difficult service to use as users have to set factors such as season adjustments and then make from two to 10 selections to complete a request. The selective access investigation done by BLS' Fran Horvath and Demetrio Scopelliti found that only nine of the 27 selective access service options resulted in 50% or more completion rates. The highest rate of completion was 67% for the mp option (Major Sector Multifactor Productivity Index). Clearly, the vast majority of selective access experiences users have end in abandonment and efforts should continue to make this service easier to use and/or to steer novices through a guided scenario or template.
The Occupational Outlook Handbook and related tools are also heavily used by people, especially in the .EDU, .IP, .NET, and .OTHER domains. Direct access to the Handbook (code F) accounted for 2.3% (.COM), 3.3% (.EDU), 1.6% (.GOV), 3.2% (.IP), 3.2% (.NET), and 3.2% (.OTHER) of the overall activity for the respective domains. More significantly, heavy user activity was logged in other Handbook pages (code t) as follows: 11.9% (.COM), 14.7% (.EDU), 7.7% (.GOV), 13.2% (.IP), 16.5% (.NET), and 15.1% (.OTHER). Not surprisingly, the overall Handbook usage of .GOV and .COM users was considerably lower than for the other domains that are more heavily dominated by home users and students. In fact, for each of these four domains, access to the Handbook (code F and t combined) was higher than any other BLS service and exceeded all home page activities (codes 1-9) combined. This was not the case for the .COM and .GOV domain users. It seems reasonable based on these patterns that the Occupational Outlook Handbook should be easily and directly accessible from the BLS homepage.
It is interesting to note help usage by the user groups. All help requests (help is available on many different pages) were coded as a W with the following percentages of usage: 2.1% (.COM), 1.8% (.EDU), 1.8% (.GOV), 1.6% (.IP), 1.9% (.NET), and 2% (.OTHER). Studies of user behavior in other information-seeking settings such as online public access catalogs show that people are generally unwilling to use help, although we might speculate that as home usage grows, more people will have no choice since a common strategy in work or public settings is to ask someone else for help. As small as these percentages are, they do reflect about 17000 requests for help during this period--an issue that cannot be ignored as the website continues to evolve.
Although users are often interested in data specific to their local regions (according to focus groups interviews in Section 3), the overall number of requests for regional data was surprisingly low. Code 6 is the homepage code for regional information and codes H-O were allocated to the eight official geographic regions. All user domain percentages were 1% or less for code 6 and no specific regional request accounted for more than 0.2% of the requests in any domain.
The codes for BLS fellowships (R), senior management (S), international training (T), and procurements (U) all yielded very few requests (few dozens) in all domains. It is unlikely that these pages should be included in subsequent coding schemes and these pages should likely be moved even deeper in the BLS site organization. The Fall 1996 reorganization did remove procurement from the two-click level of the website and this data seems to affirm that decision.
A plethora of possible analyses are feasible given the volume of data, number of codes, and variety of usage patterns that may occur. Each analysis is time-intensive and decisions about which analyses are most essential to conduct should be driven by theoretical or practical questions pertinent to the agency. The following discussion focuses on analyses that are meant to illustrate what types of questions might be addressed using the sequential log analysis techniques developed in this project. Analysis Run 2 produced a tree diagram for sequences beginning with the BLS homepage (code 0). Because the files were so large and the Sequence Program runs only on the Macintosh platform, there was not enough memory (even with virtual memory set to 100 MB) to conduct deep analyses. The program was run for each of the domain files with for a maximal depth of 3 events, set to only print those tree nodes that had at least 50 occurrences, and only consider one branch per sequence (i.e., for a session of a user who hit the home page more than once, only the first path would be counted). All of these settings are parameter options and demonstrate the huge variety in the types of analyses that might be undertaken. The tree output is presented in Appendix 4-3. From it we can see that the most common event to follow the home page is a click on an imagemap. The number of imagemap events following the homepage were as follows for the respective domains: 6795 of 12,429 (51%) in .COM; 5279 of 8714 (61%) in .EDU; 643 or 1132 (57%) in .GOV; 8309 of 19,728 (42%) in .IP; 3902 of 7461 (52%) in .NET, and 1623 of 4035 (40%) in .OTHER. Thus, more than half of the sequences that were at least two requests long and began with a BLS homepage request, then used an imagemap click to move on. The tree shows that for the .COM users, by far the most common page requested through the imagemap was the datapage (code 1), with each of the other homepage options receiving significant attention. .EDU users also requested the data page most often after the imagemap, but followed up with another imagemap request next most often but requested other home page options with the exception of economy at a glance (code 2, 116 times) less than 50 times. Tree analyses may be useful for understanding user navigational patterns but would be more useful for exploring navigational patterns if applied over longer paths.
A different approach is to identify a specific page and investigate how users arrive at this page. These analyses, known as path analyses require fewer computational resources. To illustrate this approach, Analysis Run 3 produced a path analysis for sessions that included access to the CPI news release page (code f). The parameters for this run were set as maximum length of five events, only the first such path per session was included, and printed all such paths. The complete analysis is presented in Appendix 4-4. Table 4.3.2.3 summarizes critical starting points for paths of length 5 or less that end at the CPI news release page. The most common codes that began the path are listed at the top of columns: 0=BLS homepage, 1=data mainpage, 2=economy at a glance mainpage, A=most requested series page, C=news releases mainpage, X=uncoded page, f=the CPI news release page, and q=economy at a glance graphs and other special requests. The values represent the number of times a path started with that page and ended at the CPI news release page five moves later (percentages are of the total number of paths in the analysis for each domain).
Table 4.3.2.3. Starting Points for Paths Leading to CPI news release page
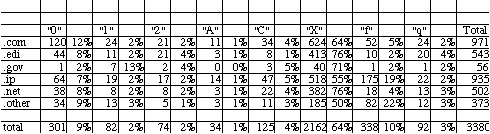
As can be seen from this table, the vast majority of paths in all domains
started with an unknown code. This is most likely explained by the fact
that neither the CPI mainpage nor the CPI table of contents page (which
is the page that results when a keyword search for CPI is done) are included
in the coding scheme. Clearly, these would be good candidates to include
in subsequent analyses. It is interesting that this becomes obvious in
this rather fine-grained analysis but was not apparent in the more aggregate
analyses above. This illustrates the importance of more substantial log
analysis investigations before procedures are routinized.
Another type of fine-grained analysis that focuses on a specific page is to investigate what events immediately precede or follow that event. One view of this is to produce a frequency table of all events that follow along with theoretically expected values. A sample of several such tables for the .COM domain only are presented in Appendix 4-5. Consider, for example, the events that immediately follow the most requested series main page. By far the most common event to follow (2543 of the 4680 "A" requests--54%) is a choice in the most requested series menu (all coded as c except for region which was coded as a "b"). However, based on overall distribution of the "c" codes in the file, we would only expect 139 (3%) such requests. Clearly, users have a purpose and are not randomly making requests. If this line of navigation is continued, we can examine what requests follow the "c" code and see that the most common subsequent event (3155 of 6797 such pairs--46%) is a "w" code, which represent a POSTING from one of the templates that define a series. Thus, about half of the users who request a series actually fill out the template and send a request to get the series. Continuing this line, if we examine the table for events that follow a "w" we see that the next most common event is another "w" (3330 of 7233 or 46%). Thus, about half of those users who do complete a request (and presumably do get a time series extracted) immediately ask for another series. Since these time series are mainly "deadends" navigationally (there are no new links, only the links to related pages or main pages at the bottom of screen presented as imagemap buttons), users can either choose one of these imagemaps or use the browser back feature (or some other feature such as bookmark, go, or enter location) to continue. Apparently about half use the browser back feature and enter another request. Only 9% (621 of the 7233) of the time did people use the imagemaps. This is considerably less that what would be predicted statistically (1013 or 14% would be expected theoretically). It seems that people who do make it this far in requesting and receiving a time series often continue to request series'.
This line of investigation can be continued or repeated for the selective access codes that are also included in the sample run in the Appendix. The example is meant to illustrate what types of fine-grained analyses are possible with transaction logs. It would of course be interesting to compare the above behavior of .COM users with .EDU or other users that tended to be less sophisticated and persistent to see it there were more abandonments.
The two types of transaction log analyses yielded several main
results:
The results from the interviews, email content analyses, and transaction logs present a complex, but still incomplete portrait of user information-seeking behavior at these sites. The interviews and email analyses illustrate the range of users and types of questions people bring to the sites. They suggest a fairly sophisticated set of professional users with K-12 students and some web novices joining in as a result of web popularity. They also highlight the need for support services policies and raise issues of resource allocation in the agencies. The transaction log analyses reveal two main points. First, they illustrate the possibilities for gaining more from summary logs than most agencies produce routinely and the possibilities for fine-grain analyses of navigational strategies if sequential analysis is undertaken. Secondly, they reveal a different picture than the interviews and to a lesser extent the email analysis in that it is clear that huge numbers of users abandon their sessions after just one or two moves, and that many users take advantage of the Occupational Outlook Handbook at BLS. Clearly, there are many new or statistically-unsophisticated users who visit these sites. A clear implication is for the agencies to think carefully about what types of services they wish to offer these new users. It is clear that the agencies have built sites with data and these new users will come to them and when they do their expectations and demands will grow and be just as unrealistic as current users' unless new design strategies are found to head off such expectations.
General Recommendations
In addition to the recommendations on transaction logging above,
these investigations suggest the following:
5.1 A theoretical view of information seeking behavior
The study of information seeking behavior has a long history in the field of library and information science. It has become increasingly important as more information resides exclusively on electronic systems. The availability of such systems has meant that the potential for people to find information without the help of knowledgeable intermediaries has increased. In such environments, however, users who may be inexperienced, uncertain, or unknowledgeable are often left to fend for themselves. Thus, researchers have been interested in learning more about user information seeking behavior in order to better support those end-users.
This extensive literature is not easily distilled. Recent works by Marchionini (1995), Wilson (1997) and Allen (1997) and earlier work by Belkin and Vickery (1985), Taylor (1991) and Dervin and Nilan (1986) are useful starting points for those wishing to learn more. While different authors present different models and theoretical underpinnings for those models, they all consider a user's information seeking behavior to be influenced (or determined by) some or all of the following:
The three aspects above influence information seeking behavior in a wide range of ways. They may influence which sources a particular user will seek out and employ, what use they make of results gleaned from these sources, and the strategies by which they interact with the sources. The latter was one object of our study. (In additional studies, it may be interesting to investigate how and when users choose to employ these sites, and what usage they make of information retrieved.)
This section of the report brings together the understanding of users and their actions that we gained through our investigations of all three sites. This understanding then leads to some general design recommendations for the three sites.
Through our discussions with agency analysts, intermediaries and other stakeholders in the sites, we developed several lists of user types mentioned by these people. Specific details on these types are mentioned in early sections of the report, so the full list across all data collection activities will not be repeated here. What we found is that terminology differences aside, and also specificity differences aside, we were able to categorize users into a small number of types. These were:
Our categories are distinguished primarily in terms of organizational mileau of a user. This choice reflects both the fact that respondents tended to offer that type of classification and also the recognition on the part of many researchers that one's behavior is constrained or bounded by what may be acceptable within an organizational context and that particular organizational contexts have particular types of problems and tasks (Taylor, 1991). Taylor refers to these organizational contexts as "information use environments." Statisticians appear as a separate category since analysts appeared to consider them a unique breed of government employee or person (residing in particular sorts of agencies). We also made a distinction between non-profit and for-profit organizations. While the categorization itself provides no indication for a rationale, examination of responses concerning non-profit organizations' tasks (e.g. writing grants) appeared to be different enough from those of for-profit organizations (e.g., trying to minimize employee salaries, find additional trading opportunities) that is seems useful to categorize them separately.
5.3 User Tasks
5.3.1 Analysis Strategy. We also gathered data on user
tasks. For our meta-analysis of these tasks, we drew on all data where
responses included expressions of questions or tasks or statistics wanted.
We wished to err on the side of inclusion rather than exclusion of possible
task information and we found that people tended to report similar types
of information in response to questions about tasks, questions, and statistics.
Our analysis is based on an examination of all data exclusive of the usability
tests (where people worked on researcher-developed tasks) and the FedStats
online comments (since there were an insufficient number of these). Appendix
5.1 provides the summarized data upon which this analysis was based.
As the project developed, we imposed several different analytic frames on our data. For the first email content analysis, we inductively derived (and checked the reliability of) a two-dimensional matrix of general question type (or strategy) and content/topic of question. Later data collection analyses (in particular the focus groups), lead to an understanding that users also included information about additional dimensions of questions including whether the data wanted were local, the currency of data, etc. These types of distinctions had the potential to lead to different types of system designs, so we deemed them important to include in our final taxonomy. In general, our goal was a taxonomy that captured all the data we had determined related to user tasks and which was able to express the differences between tasks at a level useful to make system design recommendations, and which could reflect the FedStats situation as well as the BLS/CPS situation.
5.3.2 A Generalized User Task Taxonomy. Below we present the final taxonomy of user tasks. As we developed the taxonomy, it appeared that a useful way to express its meaning was to use a linguistic metaphor. In linguistics, expressions (verbal or otherwise) can be considered to consist of a topical or semantic component, a pragmatic component (the situational or contextual aspects), and a syntactic component (how the expression is phrased). Since we are largely dealing with user queries, (and our preliminary taxonomies had moved in the general direction of the three dimensions listed below) we have adopted these terms in the taxonomy below. Our use of multiple dimensions to express an individual task is not unusual. There is a large literature on user queries, tasks, and information needs in information science. There is a general agreement that categorization by topic alone is insufficient for the specification of a system design that results in useful retrieval for users. A wide variety of dimensions have been proposed or empirically derived and are summarized in Hert (1996). In general, the field is moving towards a greater
Table 5.3.2.1: A Taxonomy of User Tasks/Questions
1. Pragmatic Dimension (Context/Situation)
1.1. Goal
learn something new (fill gap, single to exhaustive)
verify
judge/evaluate/compare
explore
1.2 Constraints (on the task)
time (information from a particular time period wanted)
amount (a particular amount of information is wanted)
geographic (information from a particular geographic area wanted)
1.3 System
2.1 Topic
2.2 concrete/abstract
2.3 specific/unspecific
2.4 faceted/non-faceted, number of facets
3. Syntactic Dimension
3.1 Expression Type
what
where
who
how
why
3.2 Goal Type
closed (fact, known item)
open/intrepretive
accretional
3.3 Specificity of Expression
inclusion of information about the user's situation and about how that
user interacts with the system.
This taxonomy is intentially not specified exclusively for tasks related to statistical data. While it is drawn from our understanding of those tasks (and thus may miss several subdimensions of importance in other domains), our intent was to provide a taxonomy that would enable its use by multiple systems. It also enables us to make general design recommendations (section 5.5) which can be specified further for the statistical sites studied here.
Our knowledge of user strategies in largely gained from the analysis of the transaction logs of the BLS sites. Rather than reiterate information from section 4 of this report, only the key findings are summarized:
Many users abandon their sessions. About half of all sessions from the .IP and .OTHER groups abandon after one request (typically the home page). Many other users have very short sessions. Thus, many users exhibit no strategy at all. In some cases this is likely very approporiate (clicked on wrong link, just exploring, etc.), but ways to better support users at the site seem imperative. Users who do stay at the site take appropriate, logical actions.
There are clear differences in expertise among users and among the different users domains. Users from the .gov and .com domains exhibit more persistent and more sophisticated behavior.
All user stategies are guided by the site organization--frequencies of access are heavier near the main home page than at deeper levels of detail. This should not be surprising in a navigation/selection environment, but does reinforce the criticalness of good site organization.
5.5 System Design Recommendations
Using our task taxonomy presented above, we now turn to some design recommendations based on that taxonomy. The taxonomy can be used to richly represent a user's task to a system. It may be reasonable for a user to complete as much of the taxonomy as possible upon entering the system (via an online form) in order for the system to present the appropriate data, put the user in a particular point in the system, or to suggest possible strategies for exploring and using the site. (Some specific examples will be provided later.) The taxonomy therefore suggests that there is no one right way to handle all tasks/queries. A query for a particular statistic known by name might lead a system to perform a keyword search but a query concerning exploration of data held at BLS would indicate that the system point the user to the BLS homepage.
The taxonomy is also designed to be specified for a particular context or system. In particular, the topics subdimension may have different categories for different sites. In terms of the sites studied in this project, in would be likely that topic categories for the BLS site would be more specific than those for the FedStats site which not only will handle a larger number of tasks but also accesses a larger variety of data. Our analysis to date suggests some particular specifications but further investigation will be necessary to flesh out the taxonomy at the appropriate level of detail for each site.
We can make a very general recommendation about use of the taxonomy given the general purpose of a particular system. A system designed as a referral system (e.g., FedStats) would benefit from rules that map questions from the taxonomy space to systems (or perhaps sets of data within those systems). Systems designed as repositories of information/data would benefit from rules that map questions onto scenarios or specific data subspaces. This recommendation leads to a recommendation, for example, that the FedStats site not attempt to make a mapping to a specific data table at an agency while the BLS or CPS site would.
Table 5.5.1 provides general design strategies for the dimensions presented in the taxonomy. These design strategies include general principals (support information concerning no hits), interface recommendations, and technical underpinnings of the system. Naturally, in a taxonomy as complex as this one, there will be some design strategies which are in conflict with others, and/or some subdimensions for which there could be multiple strategies or none at all. One way to overcome these design confusions would be to further investigate user tasks. In the absence of strategies, the current default conditions would apply (e.g., keyword search). Looking explicitly at real tasks (for a given system) and how they map to the taxonomy, will begin to suggest how subdimensions co-occur which will hopefully lead to a reduction in design conflicts or options. Some subdimensions of the taxonomy may "wither away" in particular situations and thus not need to be supported. More commonly attempted tasks could receive enhanced support.
(INSERT TABLE 5.5.1 HERE)
Specific Design Recommendations
Following from the task taxonomy and the general recomendations provided above in table 5.5.1, it would be possible to specify these for any site. Since the study was exploratory, we are not currently able to determine, for example, the frequency of given questions making an effort to do so at this point somewhat limited in value. Thus we suggest that table 5.5.1 be viewed as a template for such activities.
5.6 Users, Systems and Their Interactions
This section has so far presented a static picture of users and systems. We now add further complexity by adding the necessary component of interaction. While users may input relevant information guided by the taxonomy above, they begin to change as they start to interact with the results provided in response to that taxonomy. We therefore need to consider design implications related to that interaction.
There is an extensive literature in information science and human-computer interaction which considers the nature of this interaction and how to support it. A wide variety of models exists. Increasingly, there has been the recognition that both systems and users are changing over time, and thus users and systems need to continue to learn. Both may need to learn during the course of an interaction and be able to take something away from the interaction for use in future activities.
We might consider an interaction to look something like Figure 5.1. To the system, a user initially appears as an amorphous blob. The system looks somewhat similar to the user. For an optimal start to an interaction, each partner needs to replace the blob with a concrete structure of the other (expressed in dimensions that are understood by that partner). Thus the user may need the system blob to express its contents, how it can be searched, time of last update, what other systems it accesses, and what it is really good at (tasks it supports well). The system, we suggest, benefits from the user and need expressed in terms of the taxonomy above.
(INSERT FIGURE 5.1 HERE)
These structured representations are used to begin the interaction. The system uses the user information to place the user appropriately and the user can begin to expect certain sorts of responses from the system. As interaction continues a different sort of information needs to be available. Commonly called feedback, users and systems need to engage in a dialogue to keep both on track. In the worst case scenario, it must be possible for the user to return to the starting point (the taxonomy) and begin again. However it should also be possible for the system to find out whether the results provided are on track, and if not how can they be improved. A wide variety of feedback techniques have been suggested in the literature and many might be useful in this setting.
Finally, the interaction is terminated (hopefully because the user has made satisfactory progress towards the goal that brought him or her to the system). Along with the specific results taken away, it would be optimal (from the system's perspective) for that user to also leave with more general knowledge. From the user's perspective, it would be helpful for the system to also gain knowledge. The system should enable the user to leave with better knowledge of the system's content area and particular features of how that content area is developed and used, thus for the sites in this project, information about statistics and how to use them. Additionally, the user should leave with more insight into how to search the system successfully. Finally, the user should understand the system better (e.g., what kind of data are available). No user should leave a system not knowing why no useful information was found. It should be obvious whether the information was not available or whether the strategies used to find it were not optimal. The system should gain more information about users in general (what tasks are common) and perhaps about the particular users, possibly through user profile techniques.
5.7 Recommendations and Future Research
The discussion of users and their tasks leads to the following sets of recommendations related to a number of areas. In the following list, we do not attempt to repeat the specific recommendations offered in the sections on FedStats and BLS/CPS. Instead we provide more general recommendations which both extend those and into which those recommendations fit.
User Types:
The multifaceted analyses conducted during this project raise a number of issues for website development and management and for government agency policies and procedures. Although these issues are outside the scope of the research questions that guided the project, they are pervasive enough in the data to warrant some summarization and discussion here. Recommendations are made within the text of Sections 4 and 5 of this report but are reiterated here.
6.1. Website development and management
Websites evolve. Everyone is learning how to best serve customer needs in this new online environment. Everyone in an agency (as well as users) should recognize this and be prepared for changes, updates, and continued evolution. This not only means being tolerant of change, but actively participating in affecting it through suggestions and feedback to the technical staff responsible for development and management. This is part of the larger need for evolving corporate culture noted in the agencies section below.
Observations and Recommendations
Providing excellent customer service in an information age is less about top-down planning and automating service than it is about managing change. The websites not only reflect the corporate culture of an agency but will also lead to changes in that culture. Agencies must set a number of policies that will guide how resources are allocated, how employees work, and what kinds and qualities of service citizens and other customers receive.
Agencies might do well to consider their electronic services as digital libraries: Not simply repositories of information but interactive services that bring citizens, agency staff and information resources together.
Observations and Recommendations
It is wishful thinking that all the various websites will eventually
subscribe to common policies, procedures, vocabulary, and interfaces. This
is a highly rationalistic expectation, but one unlikely to come to fruition
because websites represent the organizational interface of agencies--the
personality of an agency. The resources and energy that have been put into
these early website efforts create an inertia effect that is difficult
to change either by mandate or collaboration. In fact, it is unlikely that
citizens want all government agencies to look and act in a uniform fashion.
Thus, the challenge of intra and interagency "control" of online resource
services is an untractable problem that requires agencies to manage change
and complexity incrementally and opportunistically rather than through
long-term logistics for people and technology. Such a perspective is one
of the lessons of the WWW in general and inherent in vibrant democratic
societies in general.
7. Conclusions and Recommendations
During the last 9 months, we have pursued several lines of exploratory inquiry in order to answer the research questions that drove this project. These questions were:
7.1.1 User Types A wide variety of user types for the sites were identified. These were: business users, academic users, the media, the general public, government users, education (K-12) users, statisticians, and libraries/museums and other non profits. There were slight differences in the categories mentioned by FedStats respondents and those offered by BLS/CPS respondents. Further detail is provided in section 5.2.
7.1.2 Tasks Users attempted (and were reported as attempting) a large set of tasks ranging from finding a specific statistic to large unfocussed interest in areas. Specific tasks are presented in Sections 3.4.1 (for FedStats) and 4.1 (for BLS). Our analysis identified common dimensions of tasks which went beyond topic to other aspects of the task that mattered (such as currency of data wanted, geographic region, etc.). We therefore developed a multi-dimensional taxonomy of user tasks (presented as table 5.3.2.1) which generalized the findings. The taxonomy is not specified for tasks related to statistical data. Instead, we strived for a taxonomy that would be useful for such tasks but also applicable to other domains.
7.1.3 Strategies This project did not conduct think-aloud sessions with users who brought actual problems to the websites. Thus, user strategies were considered using indirect techniques such as interviews with intermediaries and agency staff and making inferences from analyses of transaction logs. Excluding the large numbers of users who quickly abandon their sessions (and thus do not exhibit enough behavior to infer strategies), users were found to be mainly purposeful in their information seeking and strongly guided by the organization of the website. There were differences in how some classes of users conduct their sessions with more sophisticated users , especially those from .GOV and .COM domains, conducting longer, more frequent sessions using more data-rich information services.
7.1.4 Design Implications Our design recommendations (specifics presented in section 7.5 below) follow from a number of aspects of the investigation. In section 5.5, we provide a set of design strategies that follow from the task taxonomy. The task taxonomy can be used to represent a user's task to the system and the system can respond to that task through a variety of mechanisms. A list of possible mechanisms and their relationship to the taxonomy is presented in Table 5.5.1.
An important aspect of our design recommendations is that multiple methods of interaction and searching will be needed to support the variety of tasks users bring to the websites. In addition, contextual help will be needed in support of those tasks and in the FedStats and BLS/CPS sections of this report we provide specific examples of possible content of that help. Our findings also point to the evolutionary nature of interaction between user and system. Thus, systems need to support ongoing learning on the part of users, as well as ongoing learning about users.
7.1.5 The Organizational Perspective Websites are public interfaces for organizations. As such, they manifest the characteristics and culture of agencies. These information sources must be continually monitored and maintained as increasing numbers of new users take advantage of them and as the NII/GII continues to evolve. We make a variety of observations and recommendations in section 6.
Perhaps more important than websites reflecting agency culture is the long-term effects of websites on the agency. We argue in section 6.2 that online access will change the culture of agencies and recommend that policies and procedures for managing change rather than managing people and resources be developed.
7.2 Methodological Implications
When we began this project, the primary evaluation tool associated with Websites was considered to be transaction log counts. We significantly broadened that set of tools by including interviewing, more sophisticated transaction log analysis, email and online comment content analysis, and usability testing. This multimethod approach to evaluation is increasingly recommended for websites and other information systems (e.g., Eschenfelder, et al., 1997; and McClure, 1997 (for websites); Harter and Hert, 1997 (for information retrieval systems generally). Each method has the ability to highlight various aspects of what is increasingly recognized as a very complex, dynamic phenomenon. Our work on this project both provides a detailed sampler of the use of these methods (including particular coding schemes, analysis types, questionnaires) as well as demonstrates the utility of the methods used in combination. We hope that BLS and other organizations can make use of our work by replicating our techniques and by expanding and extending them.
Ongoing assessment will be an imperative for all organizations that provide information-based services to users. As this project has demonstrated, there is a multiplicity of user types attempting to achieve an ever-widening set of tasks, along with a steady stream of requests to agency staff for help. Combining this dynamism with the technological dynamism of the Web and with the evolving nature of organizations, leads to a situation in which organizations must continually assess their relationship to users and user tasks so that both organizational and user goals can be met as successfully as possible. It is our recommendation that BLS and the FedStats agencies work to put ongoing assessment techniques in place.
In addition to the set of evaluation techniques, metrics will also need to be developed. Given the ongoing change of a Website, many of these metrics will need to reflect change over time, or movement towards a goal rather than the attainment of a goal (as goals will change during website evolution). In essence, agencies will want to develop metrics that measure whether they are staying on course as the website is a moving target.
While we considered our primary responsibility in this project to provide a set of practical recommendations to BLS, we were also charged with approaching the task from a theoretical perspective. Our preliminary literature review indicated that little empirical work had been done concerning how and why people seek statistical information. We are pleased that this study has added significantly to that body of literature.
In particular, we believe our task taxonomy provides a useful way to understand that information seeking behavior, particularly from the perspective of offering explicit system design recommendations. Making the connection between user studies and system design has been a troublesome area for disciplines such as human-computer interaction and information science. We offer the task taxonomy as one approach to solidifying understanding of the connection.
Finally, our work on this project has brought to the fore the managerial/ organizational impacts that use of websites have. Websites exist in symbiotic (and hopefully synergistic) relationships with the organizations that support them and the users that visit them. We pointed to some particular instances of those relationships in this project. We tried to outline how those relationships might play out over time. The study of the organizational impacts of technology is a burgeoning area of interest in information science, and as far as we know, this is the first study that has empirically generated findings about those impacts for websites.
7.4 Dissemination of Study Results
Given the interest in Website assessment as well as the theoretical value of the project findings, we hope to disseminate results widely to communities such as information science, digital libraries, and the statistical community. To date we have targeted 2 conferences (The American Society for Information Science Annual Meeting, Fall 1998; The Information Seeking in Context Workshop; August, 1998) and have outlined several journal article submissions. Additional vehicles for dissemination should be sought.
Previous sections of the paper have provided a set of recommendations for action and additional research. For the reader's convenience they are summarized here.
Section 2: Methodology Recommendations
BLS and FedStats should:
The FedStats Task Force should:
Recommendations related to statistical information seeking generally:
The two types of transaction log analyses yielded several main
results:
In addition to the recommendations on transaction logging, these
investigations suggest the following:
The discussion of users and their tasks leads to the following sets of recommendations related to a number of areas. In the following list, we do not attempt to repeat the specific recommendations offered in the sections on FedStats and BLS/CPS. Instead we provide more general recommendations which both extend those and into which those recommendations fit.
User Types:
Alle, B. (1996). Information Tasks: Toward a User-centered Approach to Information Systems. San Diego: Academic Press.
Belkin, N.J. and Vickery, A. (1985). Interaction in Information Systems: A Review of Research from Document Retrieval to Knowledge-based Systems. (Library and information research reports, 35). Cambridge, UK: The British Library.
Cohen, J. (1960). A Coefficient of agreement for nominal scales. Educational and Psychological Measurement 20 (1):37-46.
Carroll, J. (1995) Editor. Scenario Based Design: Envisioning Work and Technology in Systems Development. New York: Wiley.
Chin, J. P., Diehl, V. A, & Norman, K. (1987). Development
of an instrument measuring user satisfaction of the human-computer interface,
Proc. ACM CHI '88 (Washington, DC) 213-218.
Dervin, B. and Nilan, M. (1986). Information Needs and Uses. Annual Review of Information Science and Technology. 21:3-33.
Eschenfelder, K.R.; Beachboard, J.C.; McClure, C.R. and Wyman, S. K. (1997). Assessing U.S. Federal Government Websites. Government Information Quarterly 14(2):173-189.
Glaser and Strauss. (1967). The Discovery of Grounded Theory. Aldine de Gruyter.
Harter, S.P. and Hert, C.A. (1997). Information Retrieval System Evaluation. Annual Review of Information Science and Technology, forthcoming.
Hert, C.A. (1996). User Goals on an Online Public Access Catalog. Journal of the American Society for Information Science. 47(7): 504-518.
Holsti, O.R. (1969). Content Analysis for the Social Sciences and the Humanities. Reading, MA: Addison-Wesley.
Krippendorf, K. (1980). Content Analysis: An Introduction to its Methodology. Beverly Hills, CA: Sage Publications.
Krueger, R.A. (1994). Focus Groups: A Practical Guide for Applied Research, 2nd ed. Newbury PArk: CA: Sage Publications.
Marchionini, G. (1995). Information Seeking in Electronic Environments. Cambridge, UK: Cambridge University Press.
Marchionini, G., & Crane, G. (1994). Evaluating hypermedia and learning: Methods and results from the Perseus Project. ACM Transactions on Information Systems, 12(1), 5---34.
McClure, C.R. (1997). Editorial: Assessing Networked Information Services. Library & Information Science Research 19(1): 1-3.
Robbin, A. (1992). Social scientists at work on electronic research networks. Electronic Networking: Research, Applications and Policy 2(2):6-30.
Robbin, A. and Frost-Kumpf, L. (1997). Extending Theory for User-centered information services: Diagnosing and learning from error in complex statistical data. Journal of the American Society for Information Science 48(2):96-121.
Taylor, R.S. (1991). Information Use Environments. In B. Dervin, M.J. Voight, (eds.) Progress in Communications Sciences: Vol 10. (Norwood, NJ: Ablex) pp. 217-225.
Wilson, T. (1997). Information Behaviour: An Inter-disciplinary Perspective. In P. Vakkari' R Savolainen, and B. Dervin. (Eds.) Information Seeking in Context. (London: Taylor Graham) pp. 39-50.